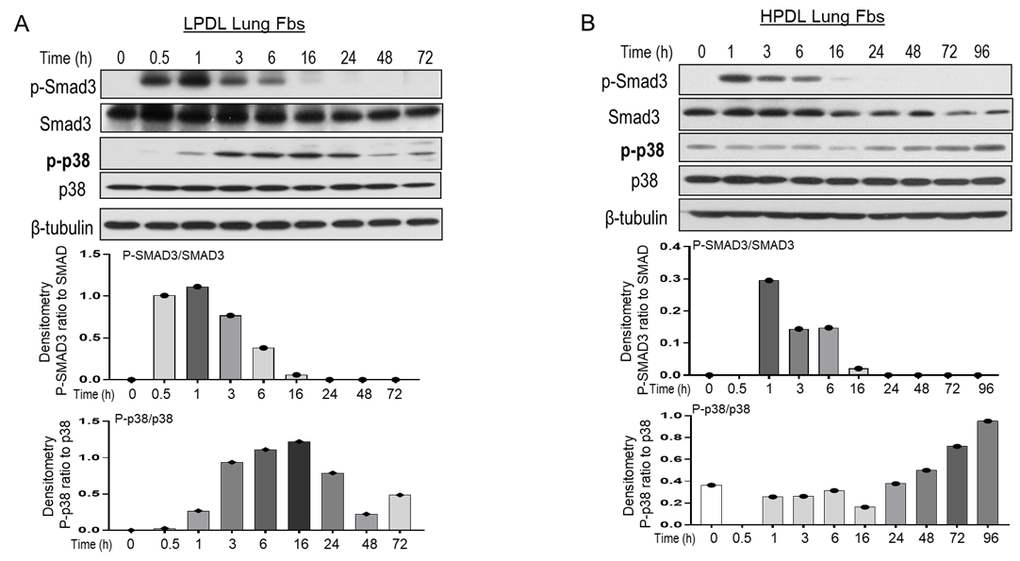
Figure 2.IMR90 LPDL or HPDL cell response to TGF-β1-induced signal pathways. (A, B) LPDL (A) and HPDL (B) lung fibroblasts lysates were collected at the indicated time points after treatment with TGF-β1 at 2ng/ml. β-tubulin was used as a loading control. Bar graphs was calculated with the shown western blots densitometric ratio of p-SMAD3 to SMAD3, or p-p38 to p38 in LPDL (A) or HPDL (B) lung fibroblasts. Similar western blots of LPDL and HPDL in response to TGF-β1 were in Supplementary Figure 2, which densitometry of p-p38 to p-38 was shown as averaged for 3 independent repeats (Supplementary Figure 2).