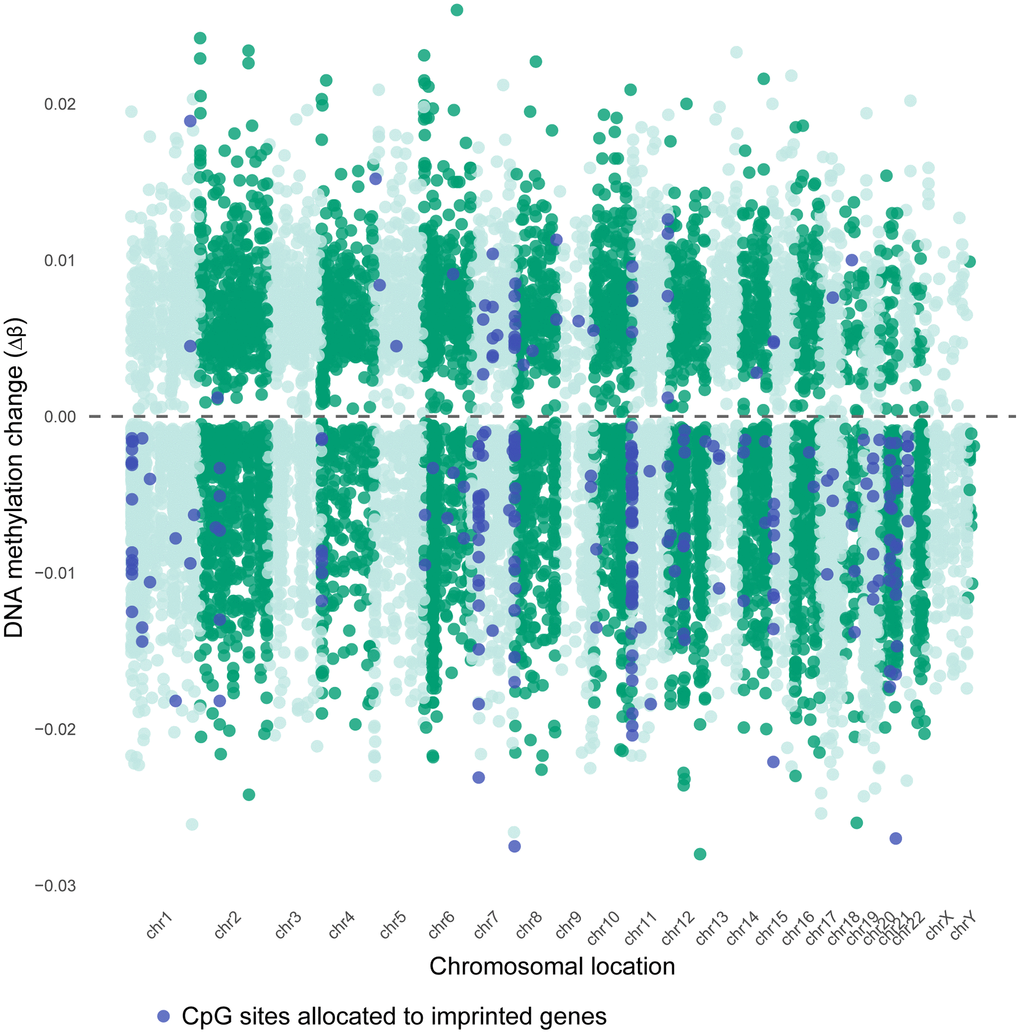
Figure 3.Chromosomal distribution of age-associated DMCs in sperm. Miami plot of age-associated differentially methylated CpG sites (DMCs), shown by direction of change (Delta β >0 relates to an increase in number of sperm cells that are methylated, Delta β <0 means a decrease in number of sperm cells that are methylated). Dashed line: no change (Δβ = 0). Delta β-values are calculated from M-values, as shown in the methods section . Significant DMCs correspond to FDR <0.05. Blue dots are sites allocated to imprinted genes, listed in the Geneimprint database.