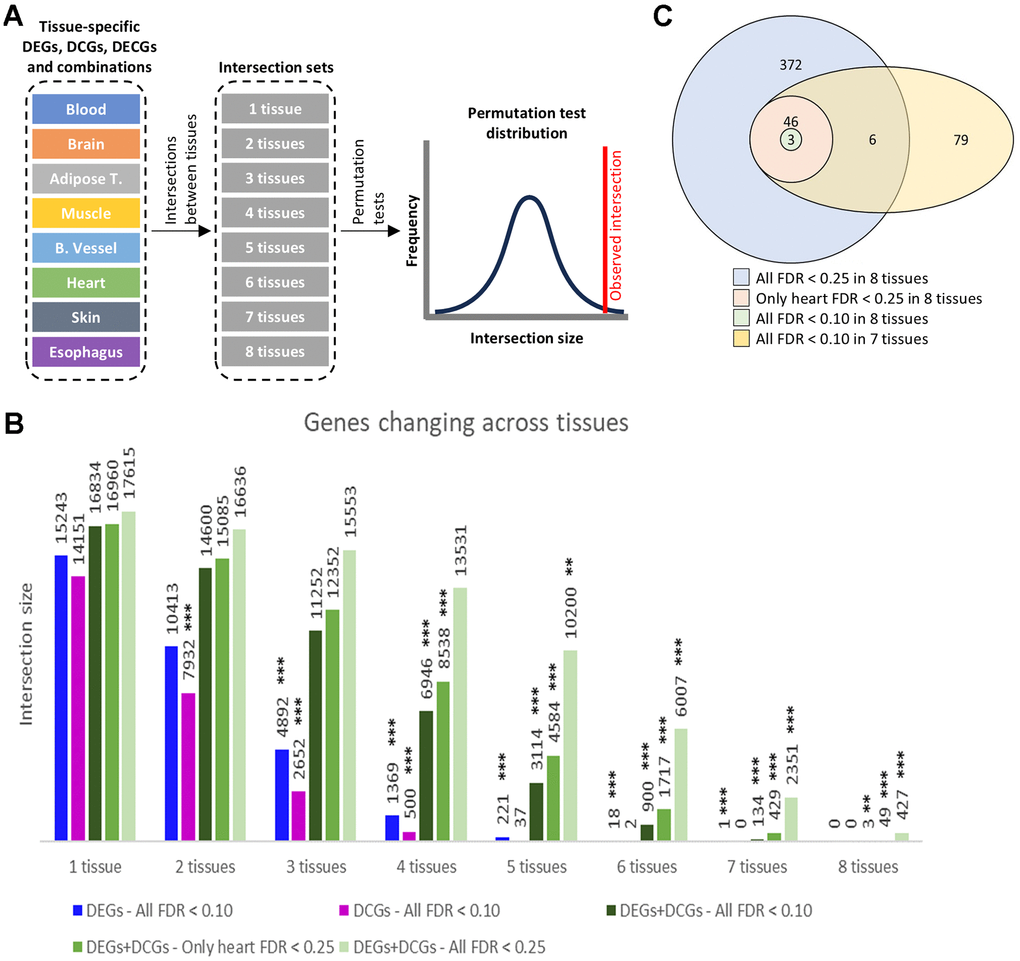
Figure 2.Intersect count. (A) DEGs, DCGs, and their combination, detected in sets of 1 up to 8 tissues. (B) DEGs, DCGs, and their combination, detected in sets of 1 up to 8 tissues. The charts display the number of genes in the set and their significance in a permutation test. Significance levels: FDR<0.1 (*), FDR<0.01 (**), FDR<0.001 (***). (C) Venn diagram of selected intersection sets.