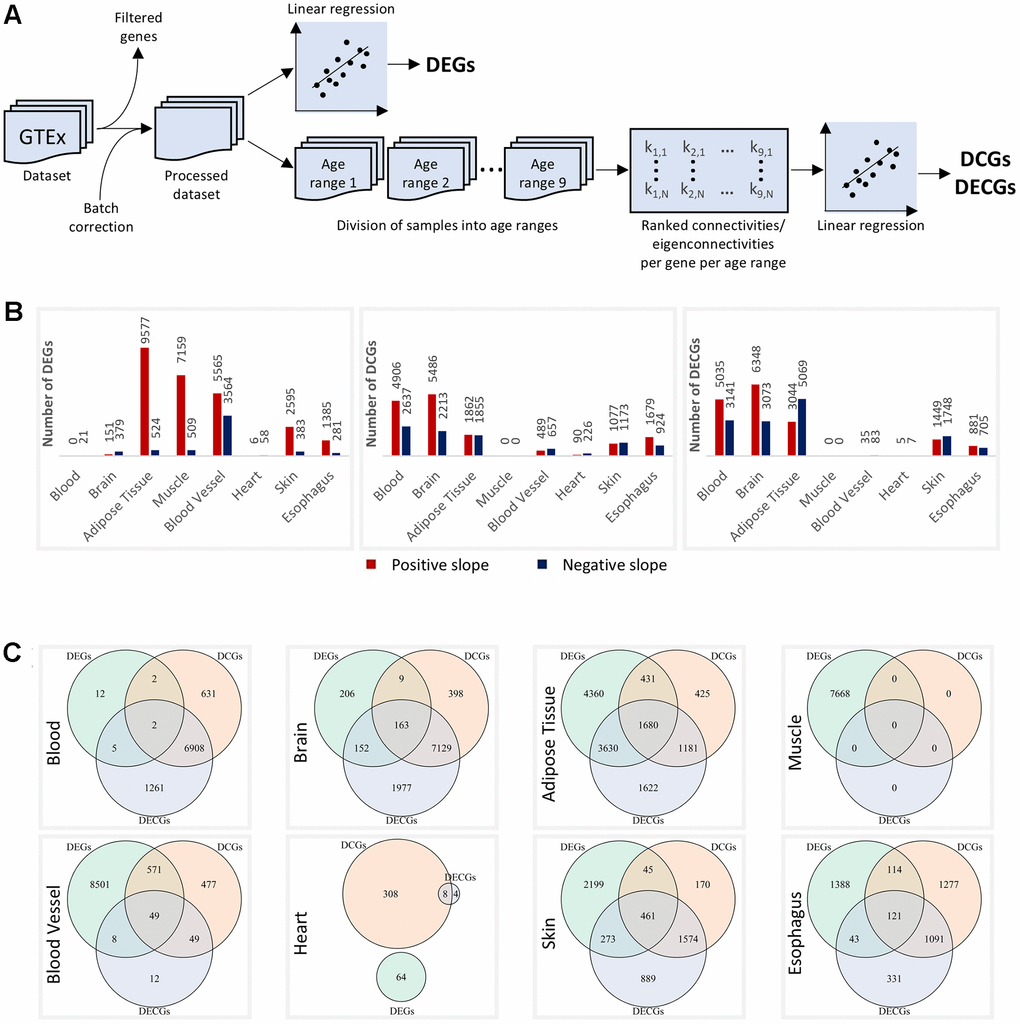
Figure 1.Altered genes per tissue. (A) Schematics of the differential expression and differential connectivity/eigenconnectivity analyses. (B) DEGs, DCGs, and DECGs per tissue. The red and blue bars represent genes with positive and negative slopes, respectively. All metrics considered FDR < 0.1. (C) Overlaps between DEGs, DCGs, and DECGs in each tissue.