Submit an Article
Navigate
Home
Editorial Board
Editorial Policies
Current Volume
Archive
Scientific Integrity
Publication Ethics Statements
Interviews with Outstanding Authors
Newsroom
Sponsored Conferences
Podcast
Contact
Special Collections
Submit an Article
Online ISSN: 1945-4589
Research Paper
|
Volume 17, Issue 8
|
pp. 2152–2166
Longitudinal relationship between social and CVD risk factors in older adults with prediabetes: the HRS 2006-2016
Back to article
Figure 2
(2 of 3)
−
100%
+
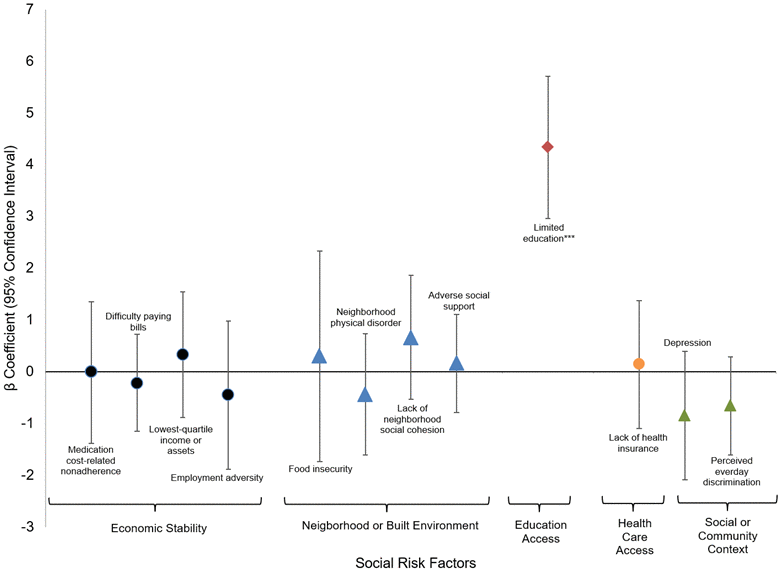
Figure 2.
Fully adjusted mixed effects linear regression for relationship between social risk factors and systolic blood pressure.
* p-value <0.05; **p-value <0.01; *** p-value <0.001.