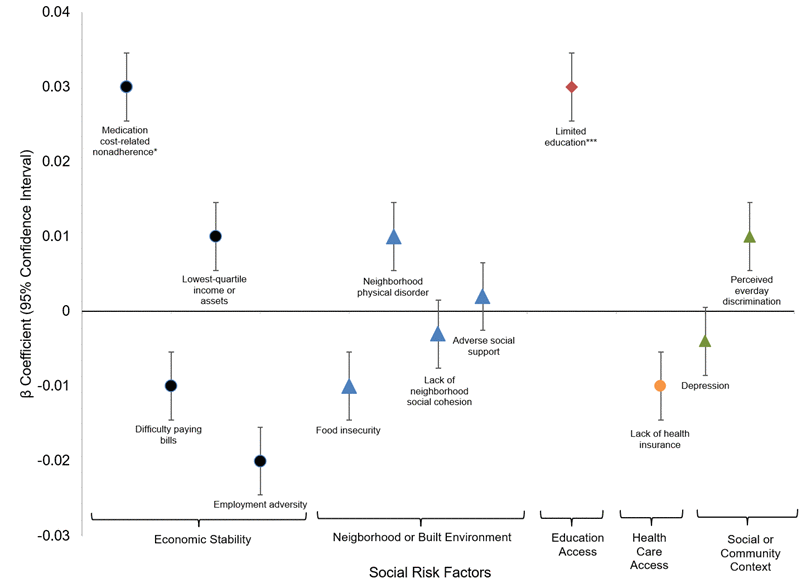
Figure 1.Fully adjusted mixed effects linear regression for relationship between social risk factors and glycemic control. * p-value <0.05; **p-value <0.01; *** p-value <0.001.
Figure 1 — Longitudinal relationship between social and CVD risk factors in older adults with prediabetes: the HRS 2006-2016 | Aging