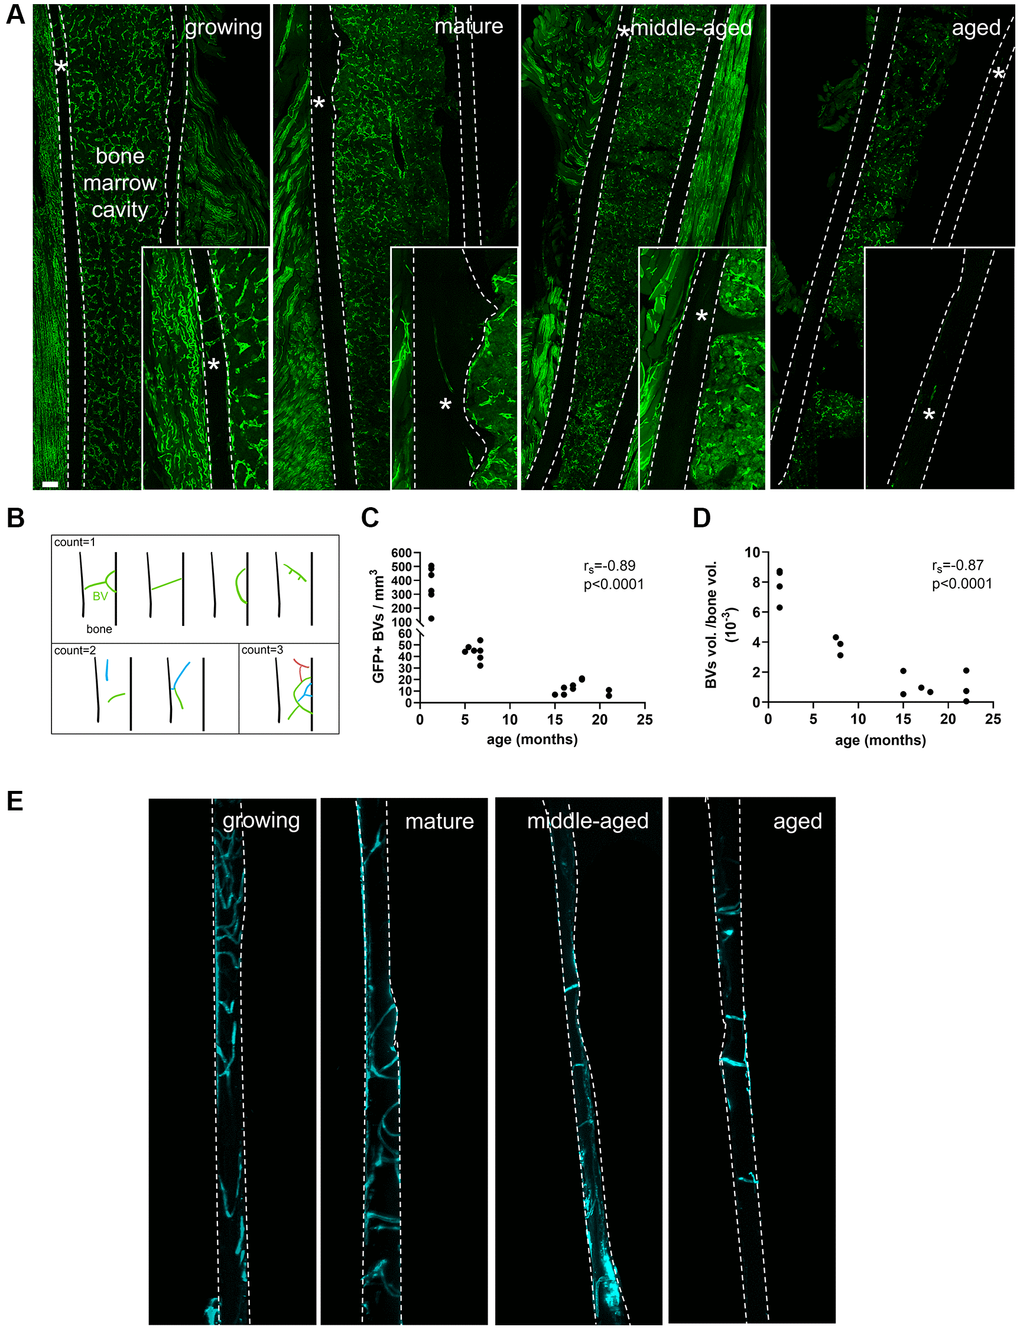
Figure 2.Blood vessel (BVs) network characterization. (A) GFP+ (green) blood vessels in growing, mature, middle-aged and aged femurs, scale bar = 200 μm. (B) Categorization of the branched vessels used for quantification. (C) Correlation between the number of GFP+ BVs per bone volume and age (months). (D) Correlation between the percentage of volume of BVs per mm3 of cortical bone and age (months). (E) Lectin+ (cyan) blood vessels in cortical bone in growing, mature, middle-aged and aged femurs. * indicates the blood vessel location. The dashed lines delineate bone. Statistical analyses: Spearman’s correlation.