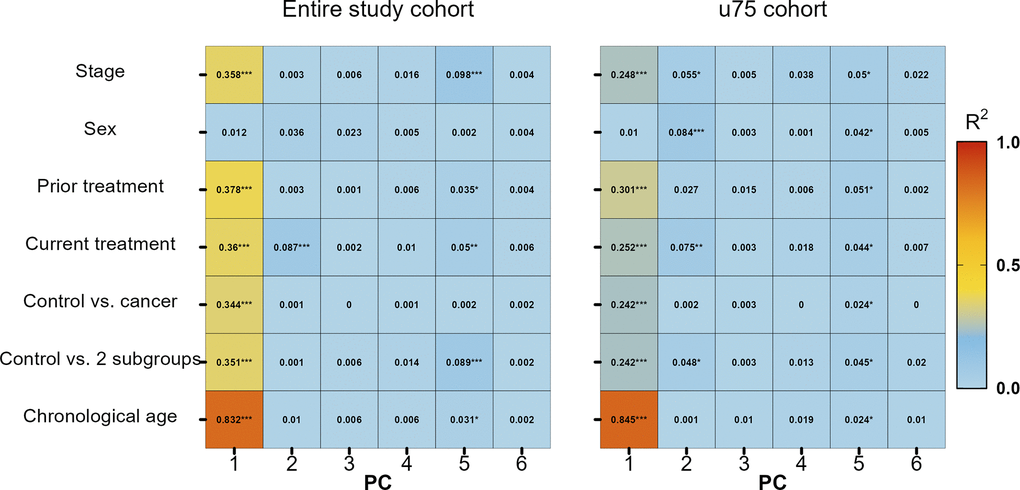
Figure 2.Variable association of stage, sex, previous treatment, current treatment, control vs. all cancer patients, control vs. two subgroups (solid and hematologic tumours) and chronological age with principal components (PC) 1 to 6. * p-value ≤ 0.05, ** p-value ≤ 0.01, *** p-value ≤ 0.001.