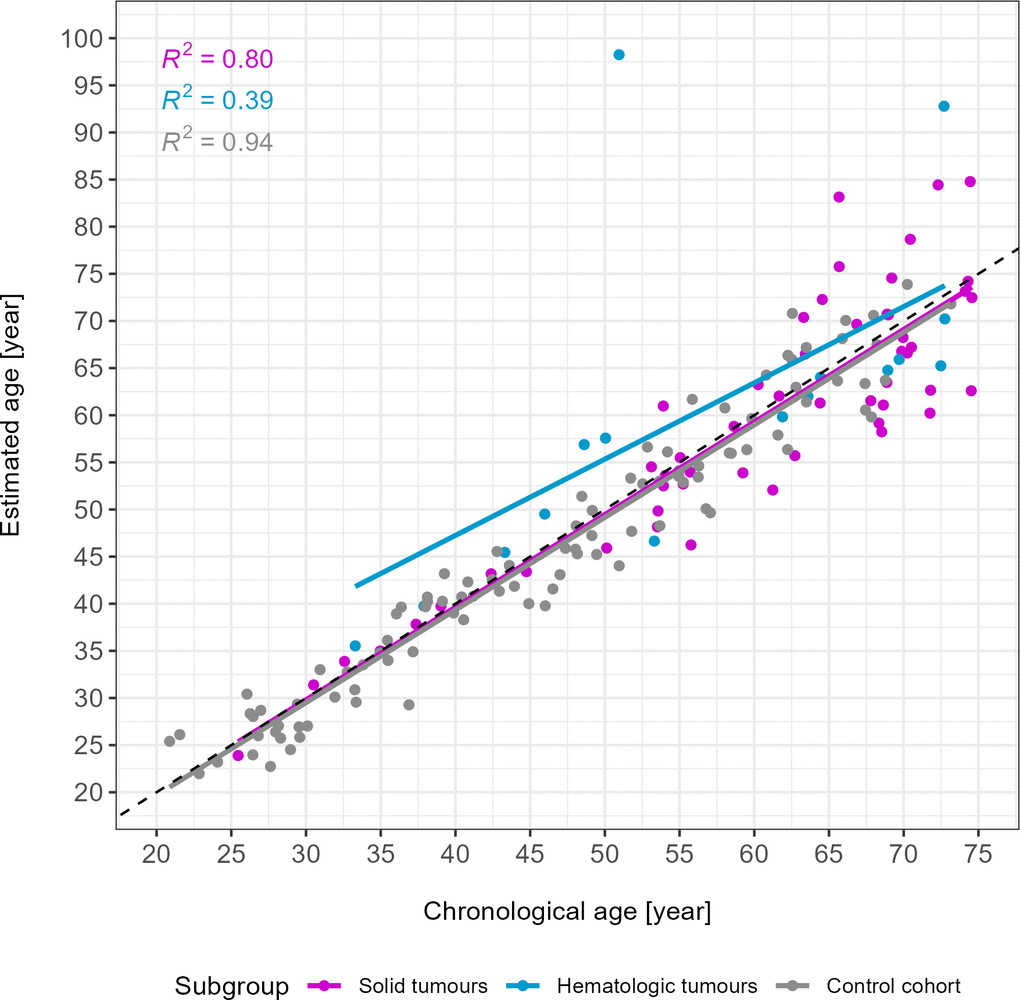
Figure 1.Age estimates of the u75 study cohort and control samples. Solid tumours are depicted in magenta (n = 53), hematologic tumours in blue (n = 16) and the control cohort in grey (n = 102). R2 of each subgroup are depicted in the upper left corner. Two outliers were identified visually. The grey dotted line is the line of identity. MAE in years: 4.66 (solid tumours), 7.59 (hematologic tumours), 2.72 (control cohort).