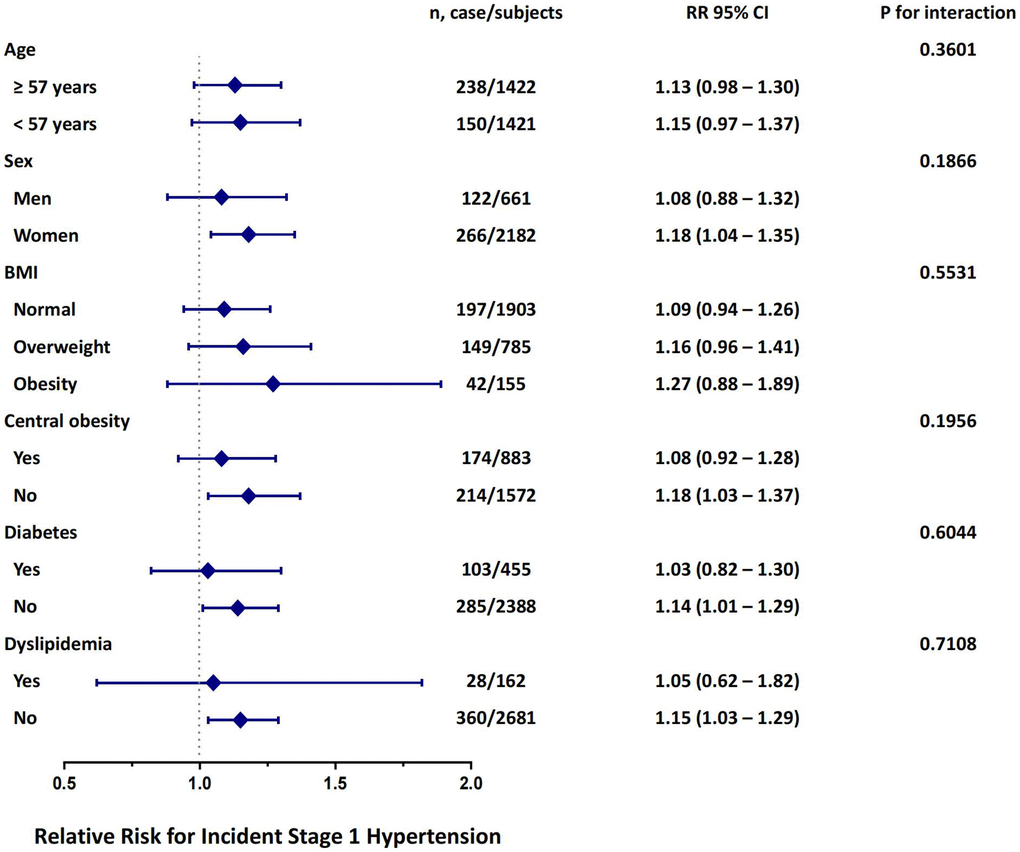
Figure 3.Risk of incident stage 1 hypertension with each quartile increase of TG/HDL-C in different subgroups at follow up. The model is adjusted for age, sex, BMI, current smoking status, current drinking status, physical activity level and previously diagnosed dyslipidemia.