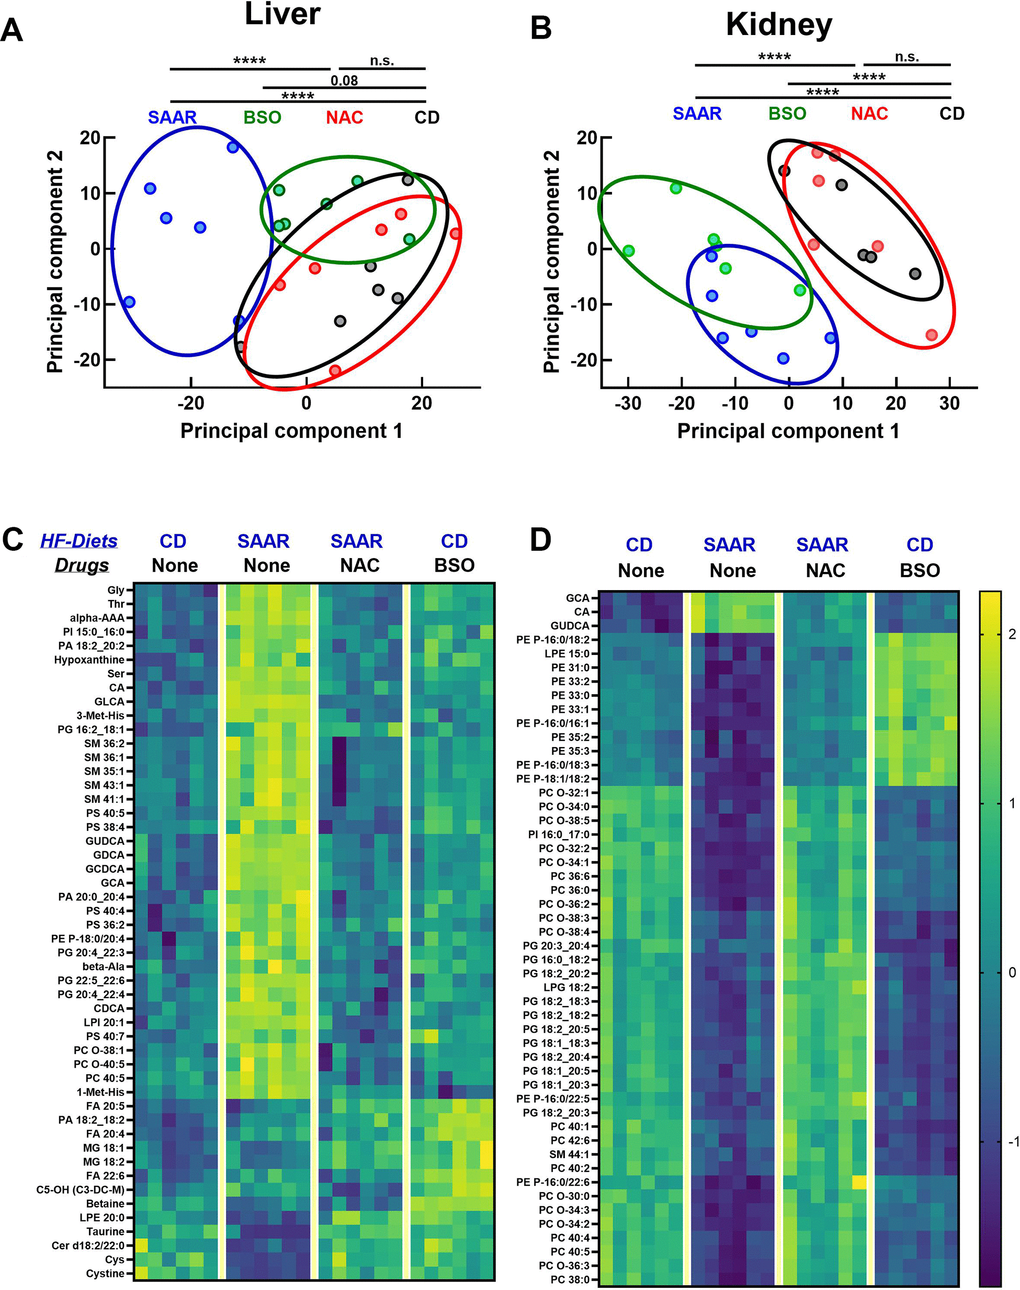
Figure 7.BSO and the SAAR diet induce similar metabolomic profiles in the kidneys. Metabolomics analyses revealed that the SAAR diet induces unique changes in the liver, which were reversed by NAC supplementation (overlap of NAC and CD clusters). (A) Although the BSO-induced changes appear as a cluster separated from CD, the statistical significance was on the borderline. However, BSO-induced changes in the kidney overlapped the SAAR-induced changes, while clusters from the NAC and CD groups overlap, indicating the reversal of SAAR diet-induced changes (B). Heat maps of the metabolites with the most significant changes in the liver and kidney are shown in (C, D).