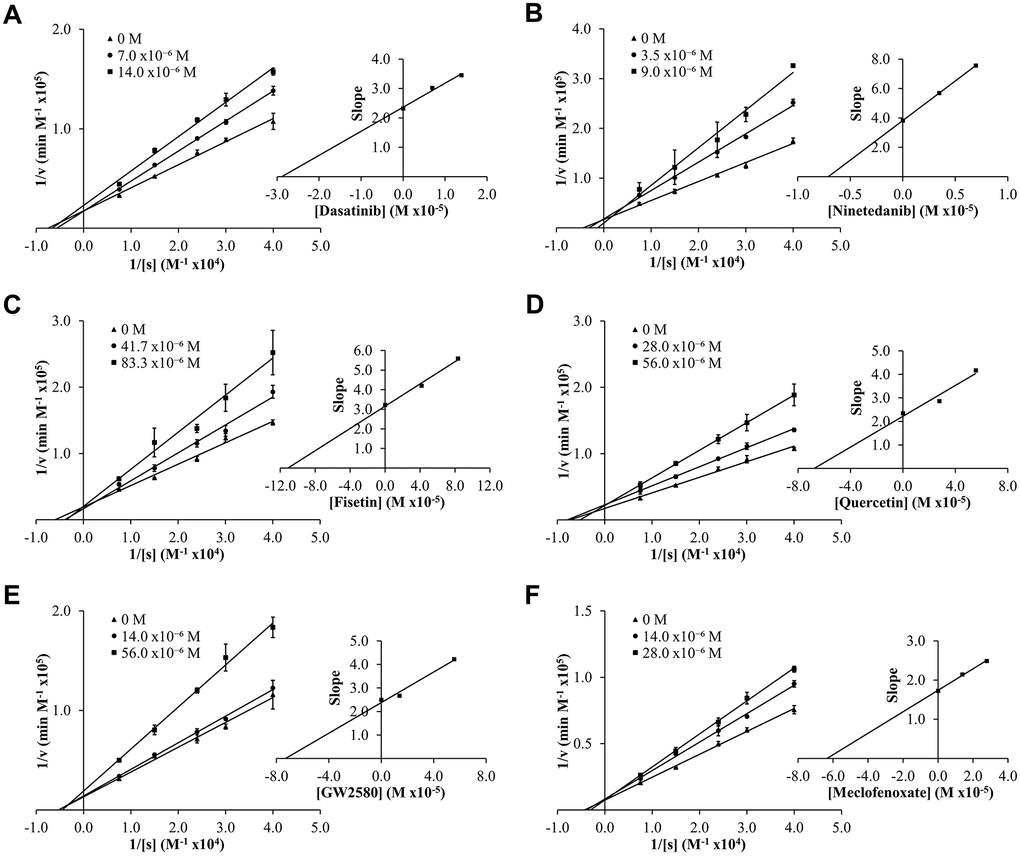
Figure 2.Lineweaver-Burk (LB) plots showing inhibition of acetylcholinesterase (AChE) upon treatment with varying concentrations of senolytic and nootropic agents 1-6 (A–F, respectively). Each compound was assessed at a range of concentrations (0-83 μM), with 0 M (▲), middle concentration (●), and highest concentration (■). Slopes from LB plot trendlines were plotted against compound concentrations to generate Ki values as the x-intercept (insert graphs). Enzyme kinetic experiments were performed in triplicate and kinetic parameter values were averaged.