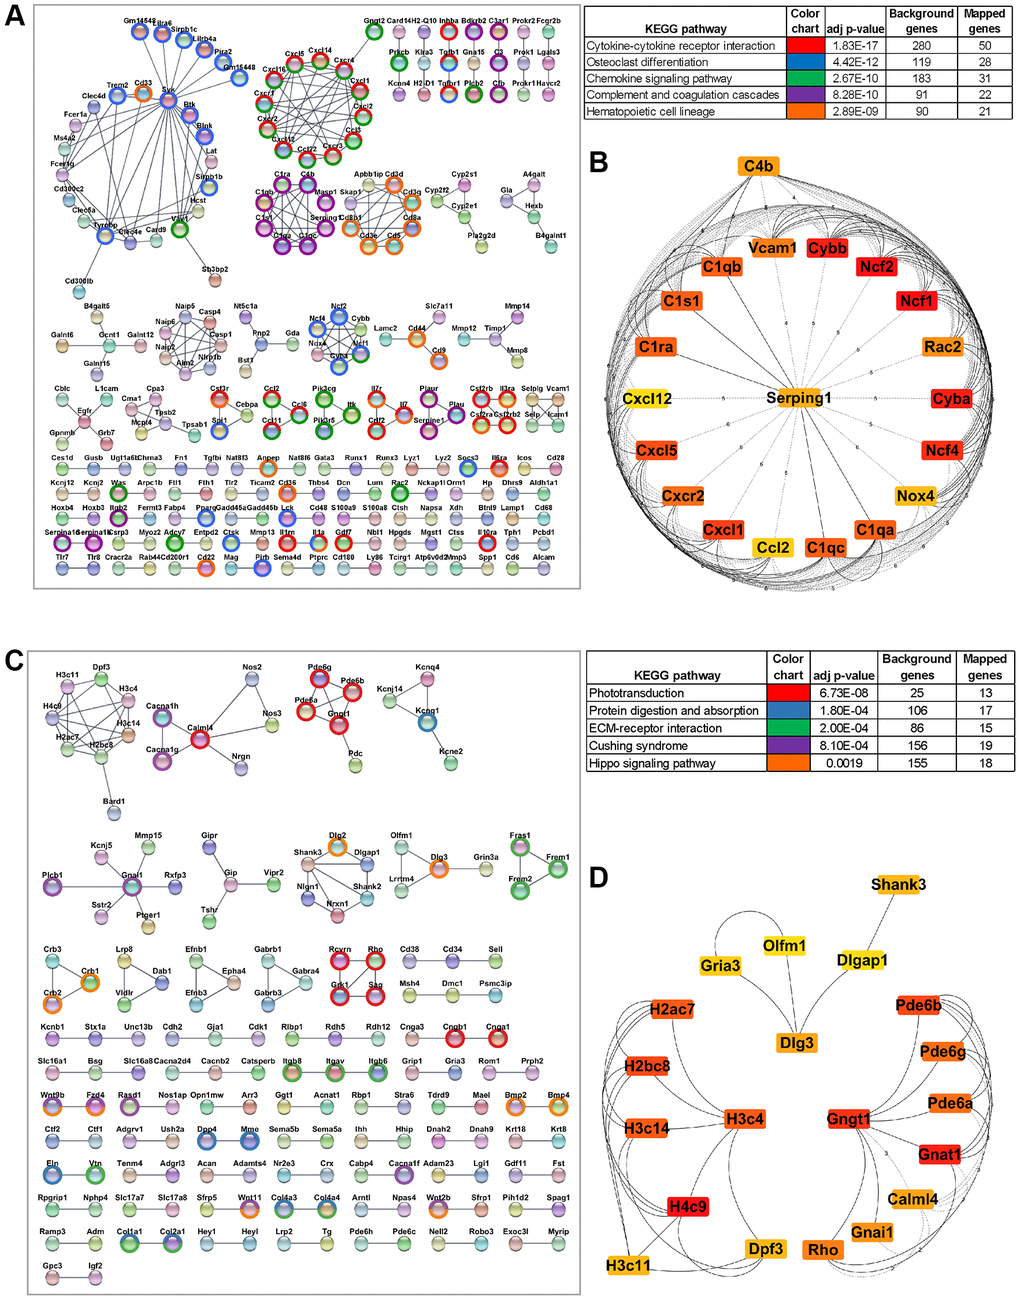
Figure 3.Protein-protein interaction (PPI) network of differentially expressed genes and the hub genes. (A) STRING network of PPI generated using DE genes upregulated in aging RPE/choroid (FDR <0.05, log2 fold change >1). Significant clusters from the PPI network complex were constructed using the Cytoscape MCL plugin. Genes mapped to top KEGG pathways are highlighted. (B) The top 20 hub genes in the PPI network were identified using the Cytoscape plugin cytoHubba based on their maximal clique centrality (MCC) score. The 20 identified hub genes are displayed from red (high MCC score) to yellow (low MCC score). (C) PPI network constructed using DE genes downregulated in aging RPE/choroid (FDR <0.05, log2-fold change >0.05). The network is subclustered using the Cytoscape MCL plugin and the highlighted genes are mapped to top KEGG pathways. (D) Top 20 aging downregulated hub genes screened by the cytoHubba plugin of Cytoscape based on the MCC score where red nodes represent a higher MCC score and yellow represents a lower score.