Submit an Article
Navigate
Home
Editorial Board
Editorial Policies
Current Volume
Archive
Scientific Integrity
Publication Ethics Statements
Interviews with Outstanding Authors
Newsroom
Sponsored Conferences
Podcast
Contact
Special Collections
Submit an Article
Online ISSN: 1945-4589
Research Paper
|
Volume 17, Issue 3
|
pp. 643–656
Accelerated aging associated with cancer characteristics and treatments among breast cancer survivors
Back to article
Figure 2
(2 of 2)
−
100%
+
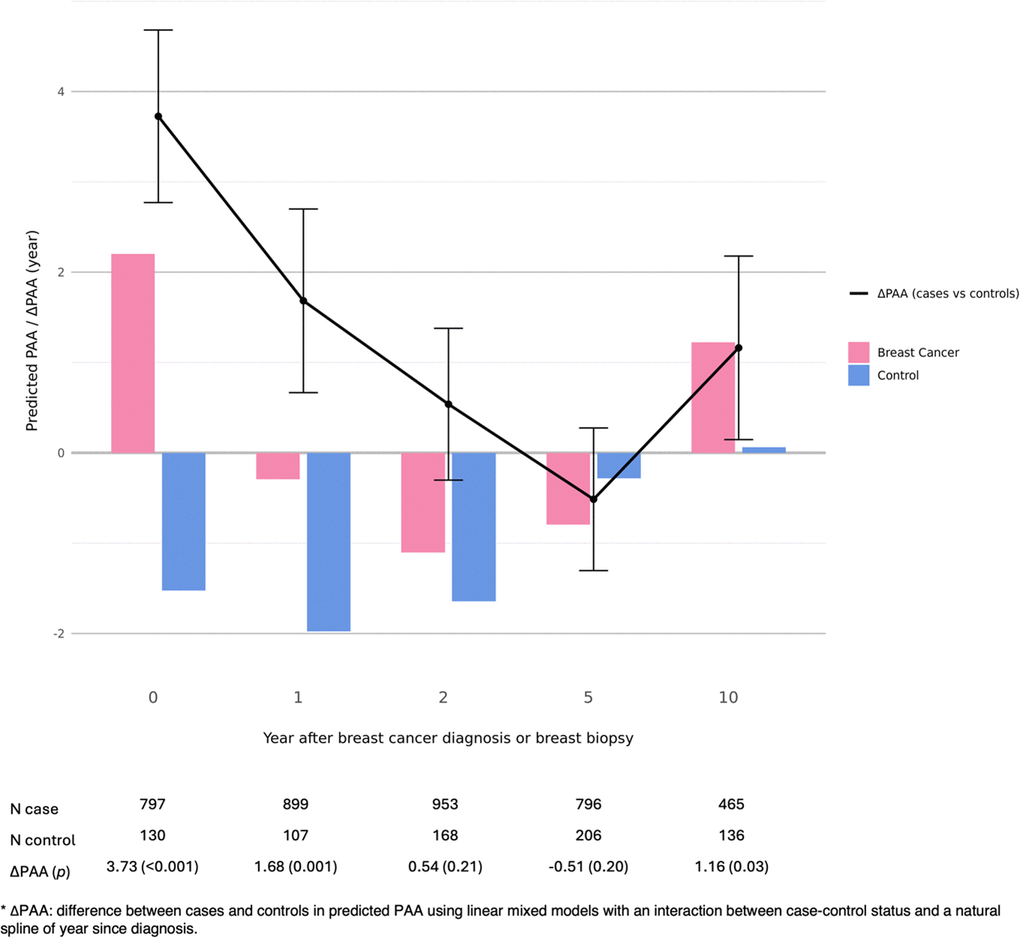
Figure 2.
Difference in predicted PAA between breast cancer cases and controls by year since diagnosis.