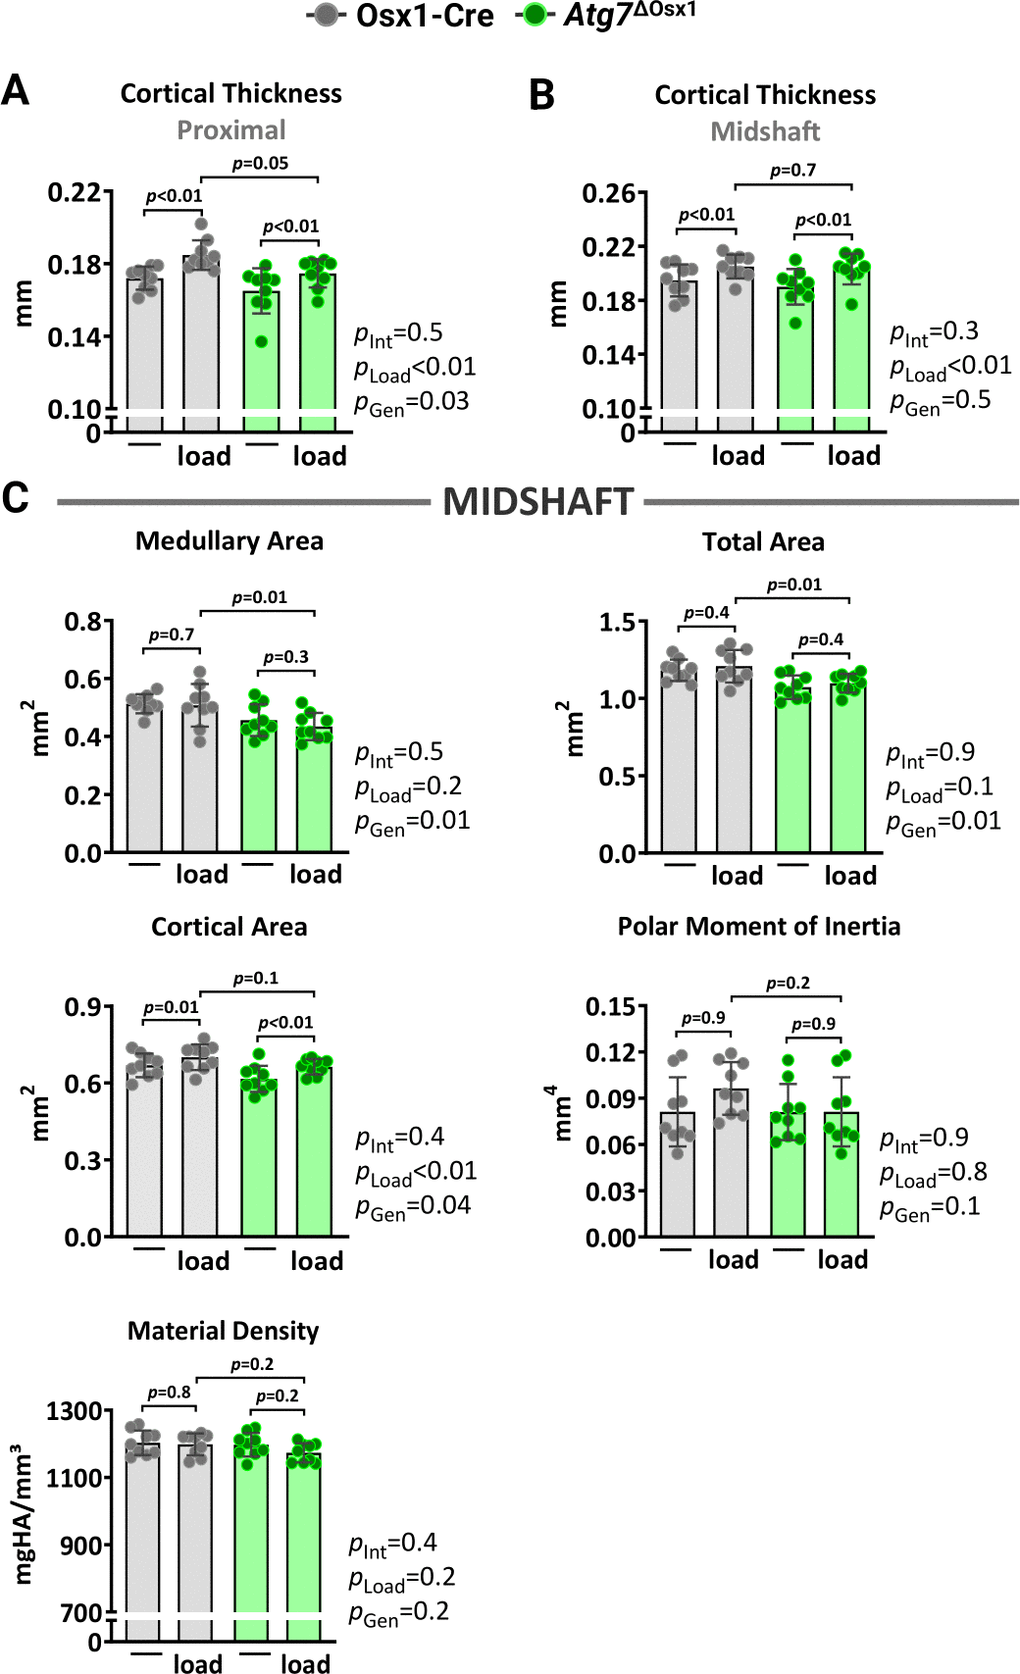
Figure 6.Lack of autophagy in osteoblast lineage does not alter load-induced increase in cortical bone mass. Micro-CT measurements at 5 mm proximal to the tibiofibular junction (A) and at the midshaft (B, C) of the right (non-loaded) and left (loaded) tibiae from Osx1-Cre (n=9) and Atg7ΔOsx1 (n=9) female mice. The tibiae of Osx1-Cre and Atg7ΔOsx1 mice were loaded with -7.6N and -7.3N, respectively, to achieve +1200με peak strain, following the timeline shown in Figure 1B. Bars represent mean ± SD. Data analyzed by two-way mixed ANOVA; p-values adjusted by Holm-Sidak’s test. Int: Interaction; Gen: Genotype.