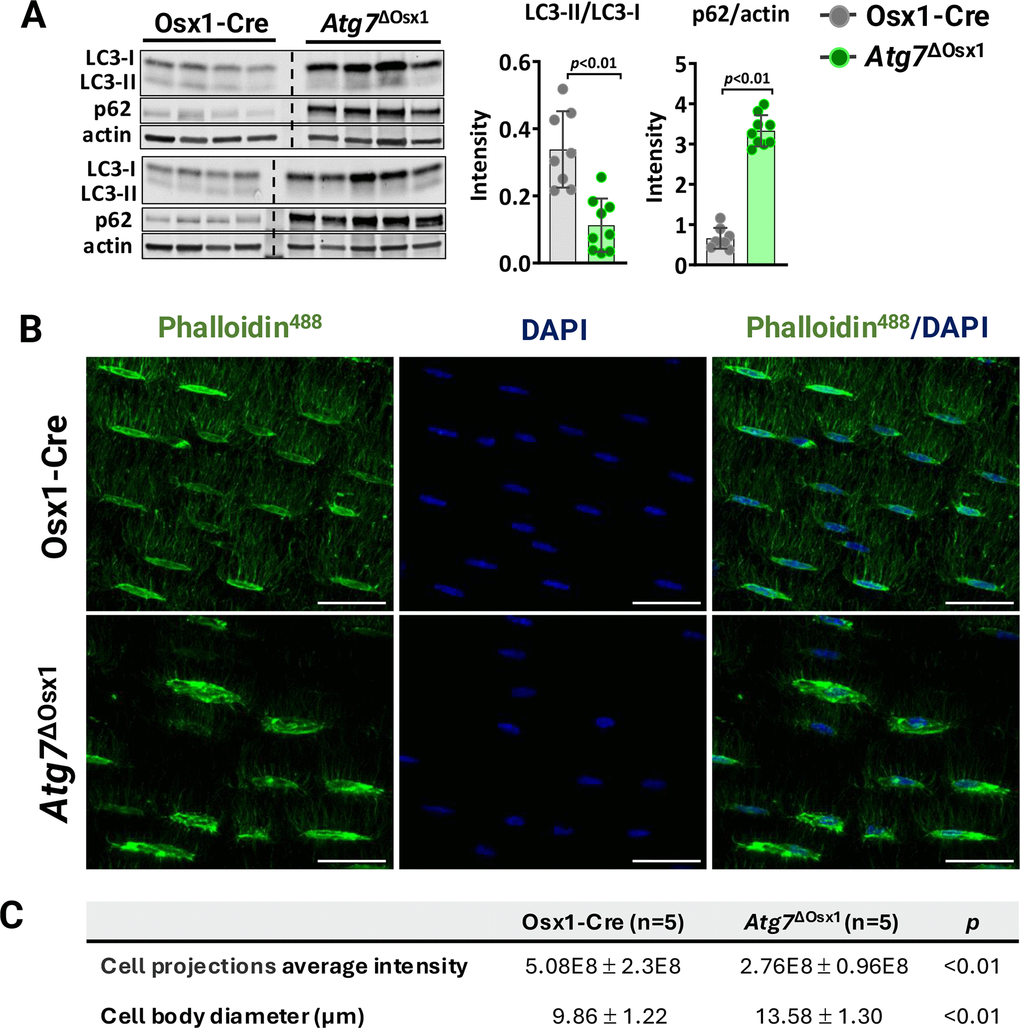
Figure 5.Atg7 deficiency in osteoblast-lineage cells disrupts the osteocyte network. (A) Western blot (left) and quantification of band intensity (right) in protein lysates extracted from humeri shafts of Osx1-Cre (n=8) and Atg7ΔOsx1 (n=9) female mice. (B) Representative images of osteocyte network in femoral cortical diaphysis stained with phalloidin-Alexa488 [green] and DAPI [blue]. Scale bar, 200 μm. (C) Average fluorescence intensity of osteocyte projections and cell body diameter. Bars represent mean ± SD. Data analyzed by two-tailed unpaired t-test.