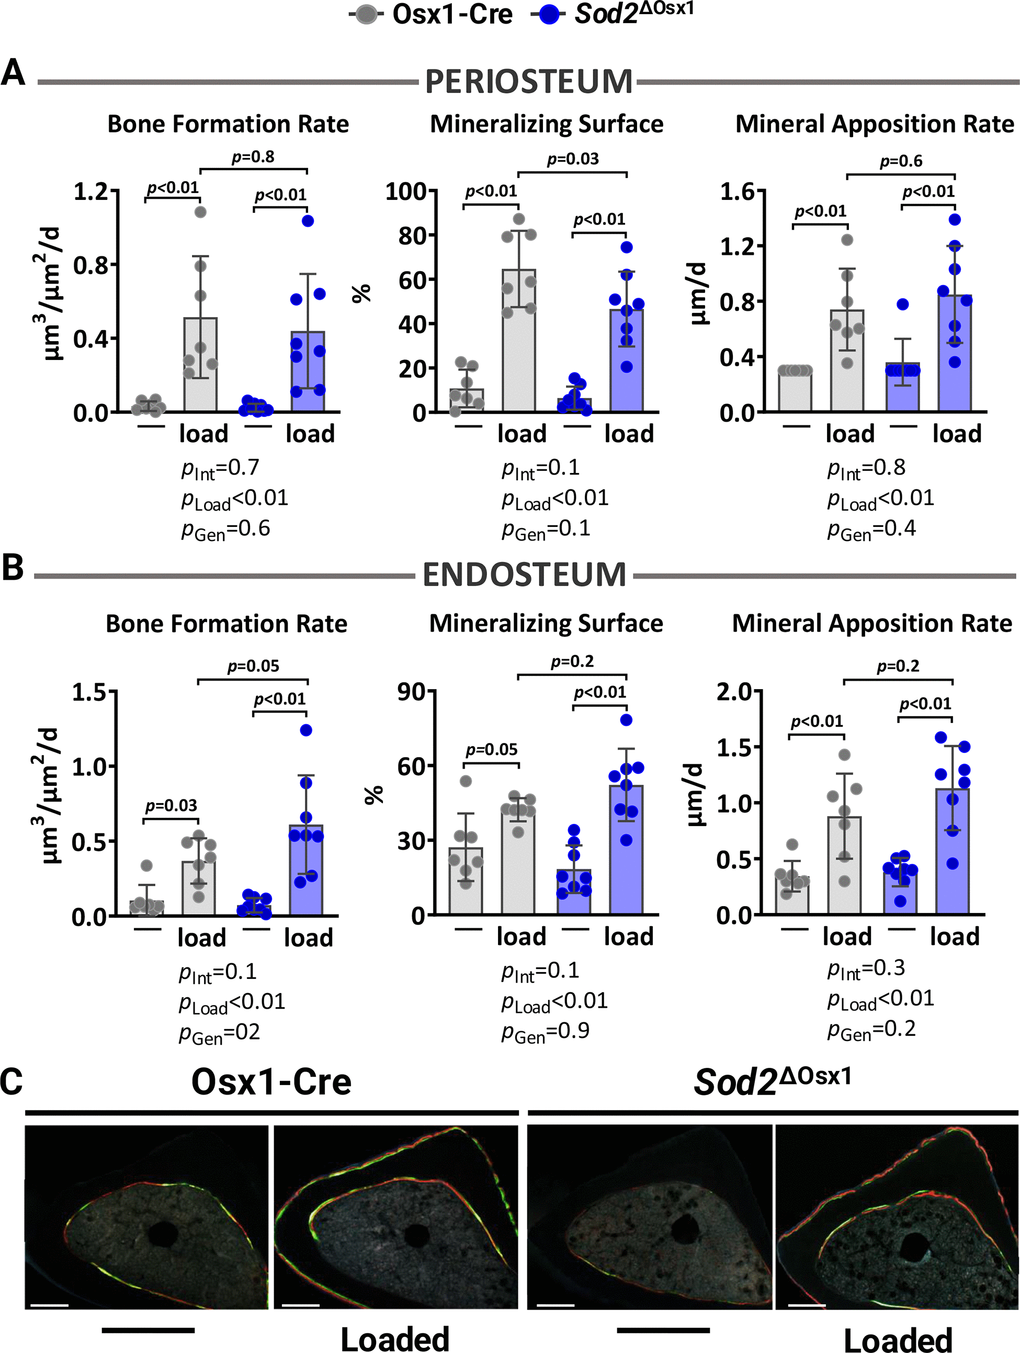
Figure 4.Excessive mitochondrial ROS in osteoblast lineage does not impact load-induced bone formation. Histomorphometric measurements at the periosteal (A) and endosteal (B) tibial surface at 5 mm proximal from the tibiofibular junction of the right (non-loaded) and left (loaded) tibia from Osx1-Cre (n=7) and Sod2ΔOsx1 (n=8) female mice, and (C) representative photomicrographic cross-section images. Scale bar, 200 μm. Bars represent mean ± SD. Data analyzed using two-way mixed ANOVA; p-values adjusted by Holm-Sidak’s test. Int: Interaction; Gen: Genotype.