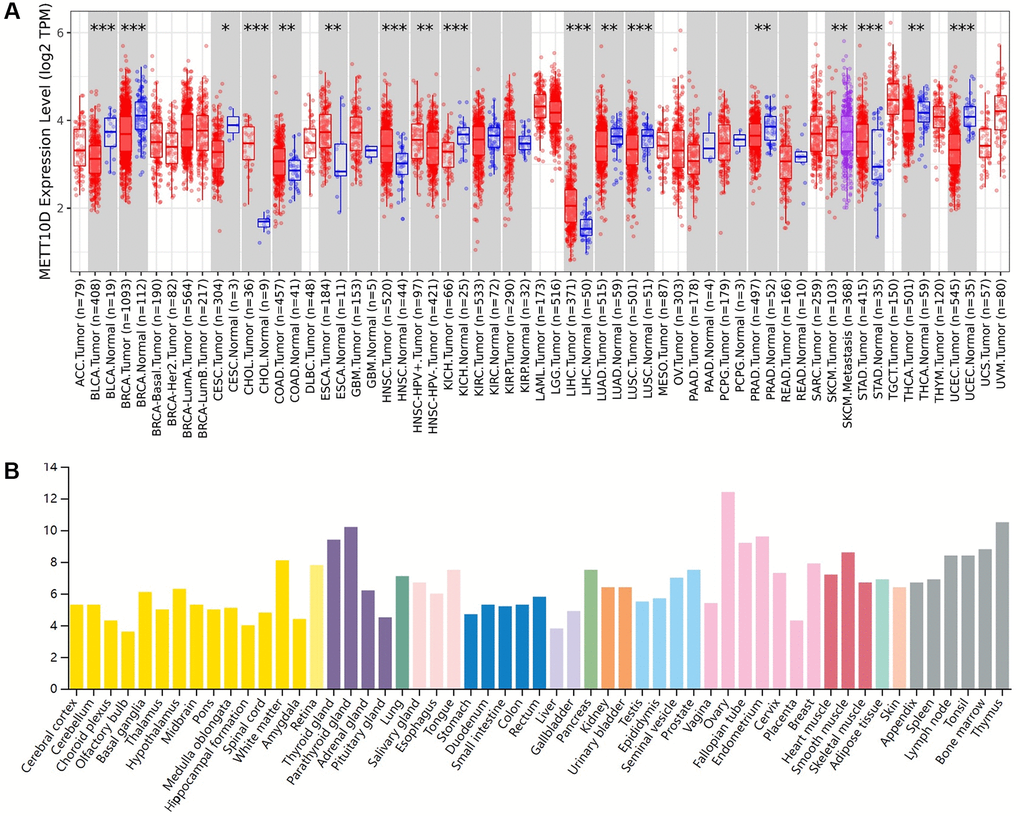
Figure 1.Expression level of METTL16 in human tumors. (A) Expression level of METTL16 in TCGA tumors vs. adjacent tissues as visualized by TIMER2. *P < 0.05; **P < 0.01; ***P < 0.001. (B) The RNA expression level across different organs in HPA database.