Submit an Article
Navigate
Home
Editorial Board
Editorial Policies
Current Volume
Archive
Scientific Integrity
Publication Ethics Statements
Interviews with Outstanding Authors
Newsroom
Sponsored Conferences
Podcast
Contact
Special Collections
Submit an Article
Online ISSN: 1945-4589
Research Paper
|
Volume 17, Issue 2
|
pp. 563–587
Study on the use of black phosphorus quantum dots in the treatment of atherosclerosis
Back to article
Figure 6
(6 of 8)
−
100%
+
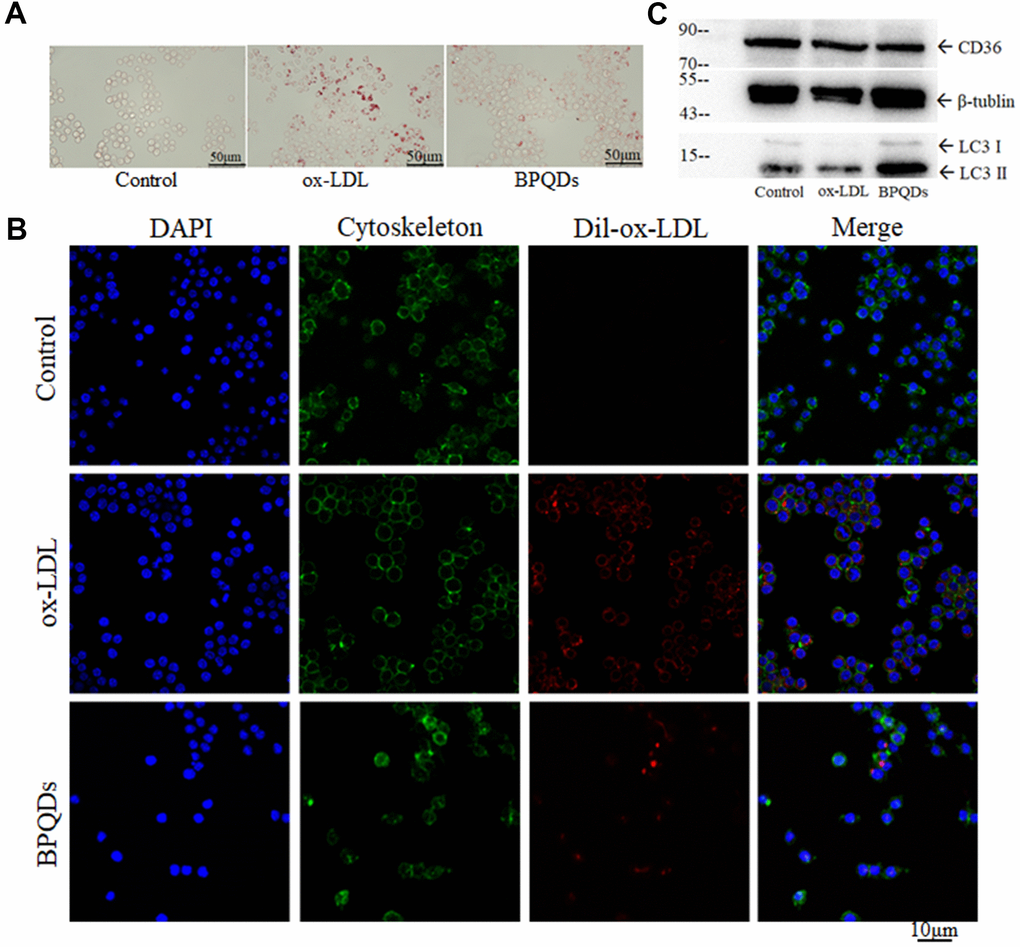
Figure 6.
(
A
) Oil red O staining of macrophages/foam cells. (
B
) Fluorescence intensity of ox-LDL observed by confocal. (
C
) Western blot of CD36 and LC3 II / I.