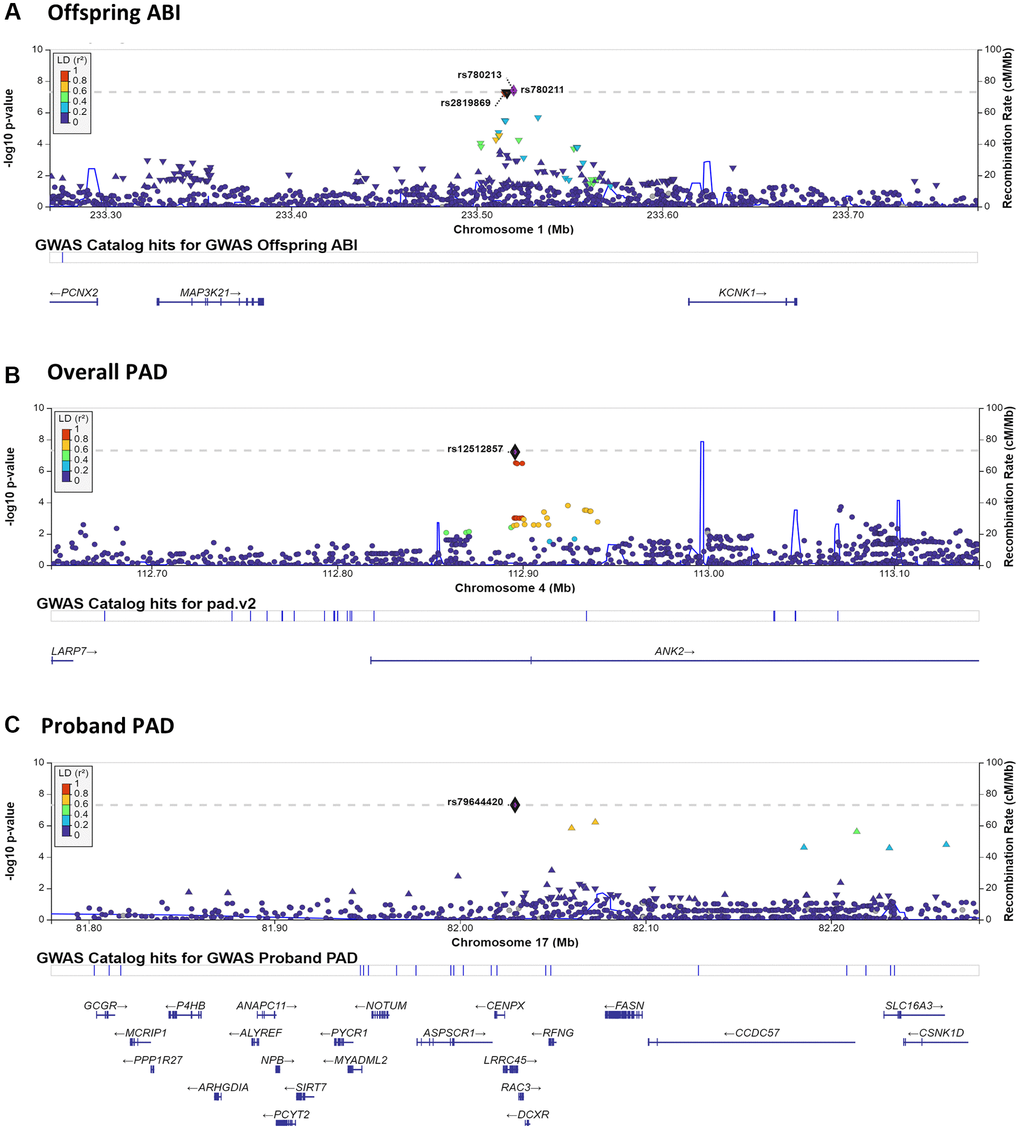
Figure 1.LocusZoom plots surrounding notable GWAS results. LocusZoom plots are shown for each of the three significant or highly suggestive GWAS results shown in Table 3. Plots include 250 KB up- and down-stream of the index SNP. Results by panel include: (A) chromosome 1– Offspring ABI; (B) chromosome 4– Overall PAD; (C) chromosome 17– Proband PAD.