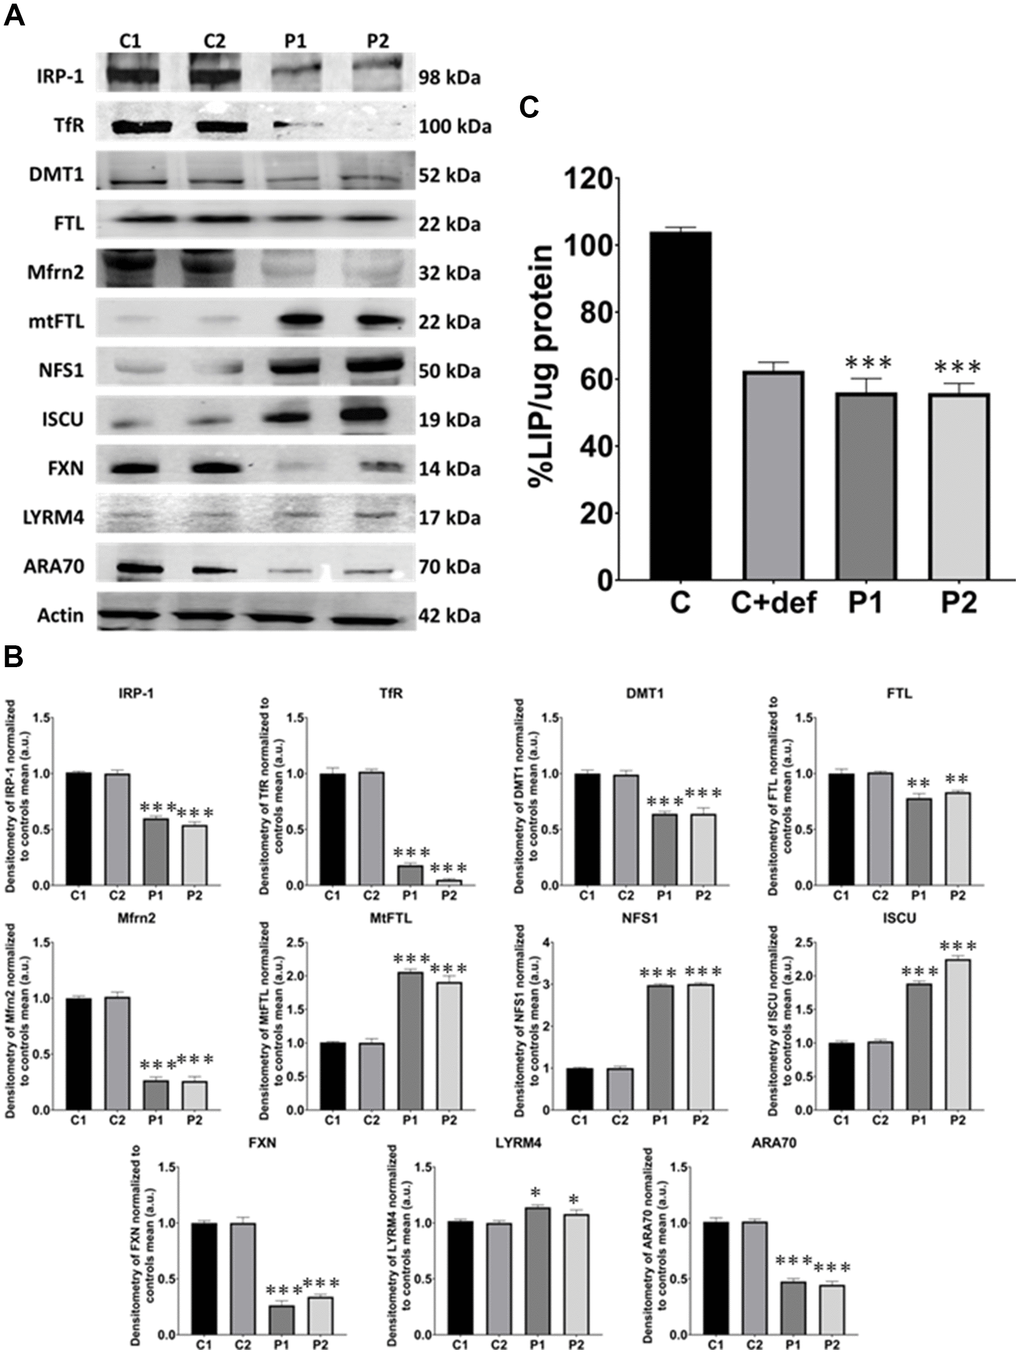
Figure 6.Iron metabolism analysis in control (C1, C2) and MS (P1, P2) fibroblasts. (A) Immunoblotting analysis of proteins implicated in iron metabolism. Actin was used as the loading control. (B) Band densitometry of Western Blot data normalized to the mean of controls and referred to actin levels. (C) LIP percentage. C represents the mean of C1 and C2 data. C1 and C2 cells treated with 100 μM deferiprone were used as a negative control. Data represent the mean ± SD of three separate experiments. *p-value < 0.05, ***p-value < 0.0001 between control and MS fibroblasts.