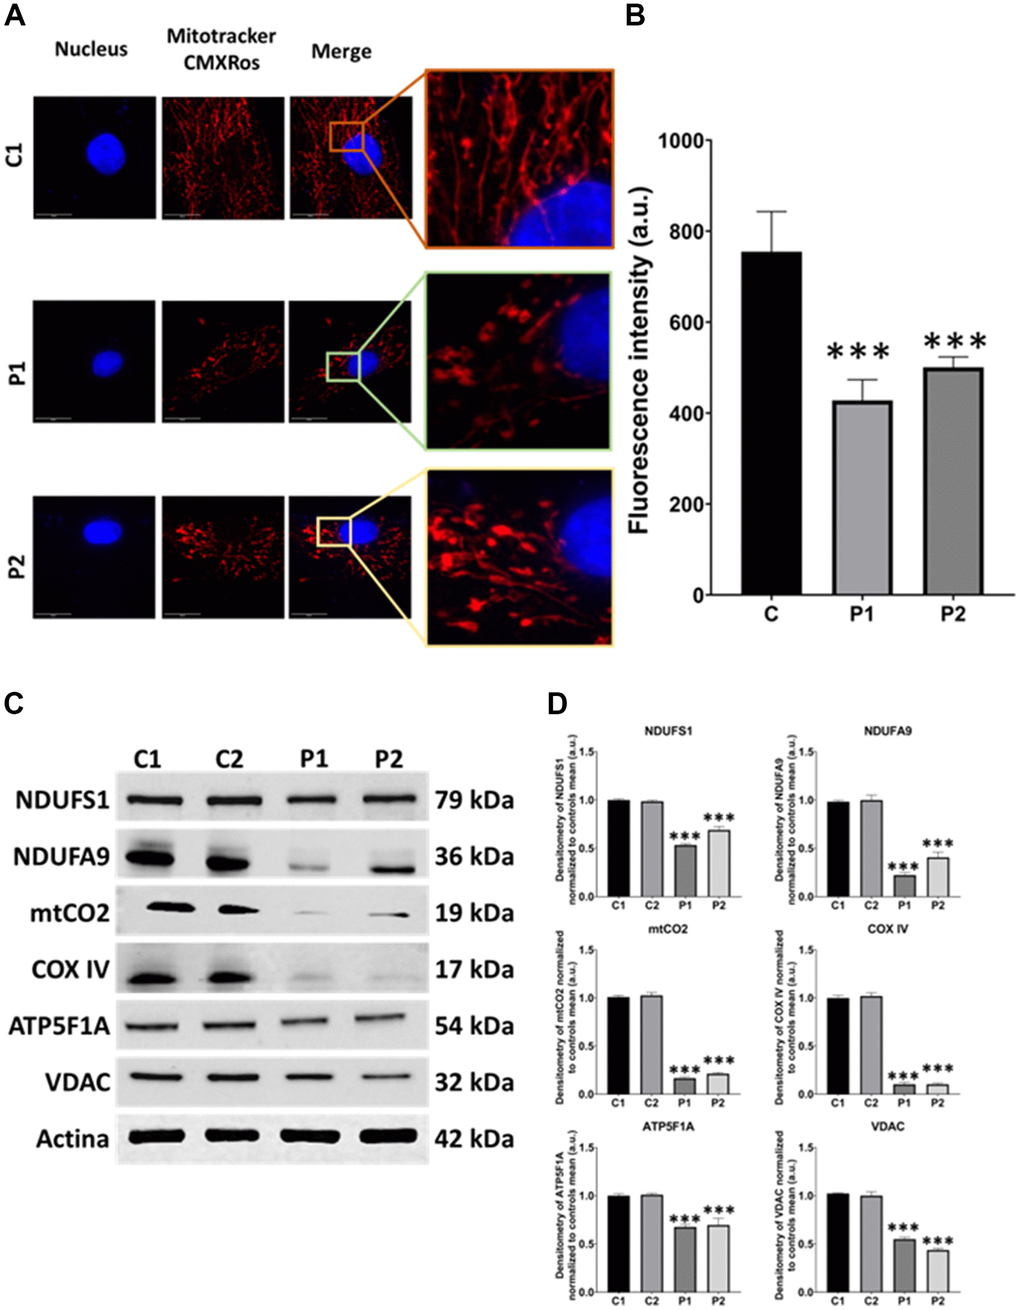
Figure 3.Mitochondrial network morphology and polarization, and protein expression levels in control (C1, C2) and MS (P1, P2) fibroblasts. (A) Representative images, acquired from a DeltaVision microscope. Scale bar = 20 μm. (B) Quantification of fluorescence intensity. C represents the mean of C1 and C2 data. (C) Immunoblotting analysis of mitochondrial proteins from complex I (NDUFS1, NDUFA9), complex IV (mtCO2, COX IV), and complex V (ATP5F1A). VDAC was used as a mitochondrial mass marker. Actin was used as the loading control. (D) Band densitometry of Western Blot data normalized to the mean of controls and referred to actin levels. Data represent the mean ± SD of three independent experiments. ***p-value < 0.0001 between control and MS cells. a.u.: arbitrary units.