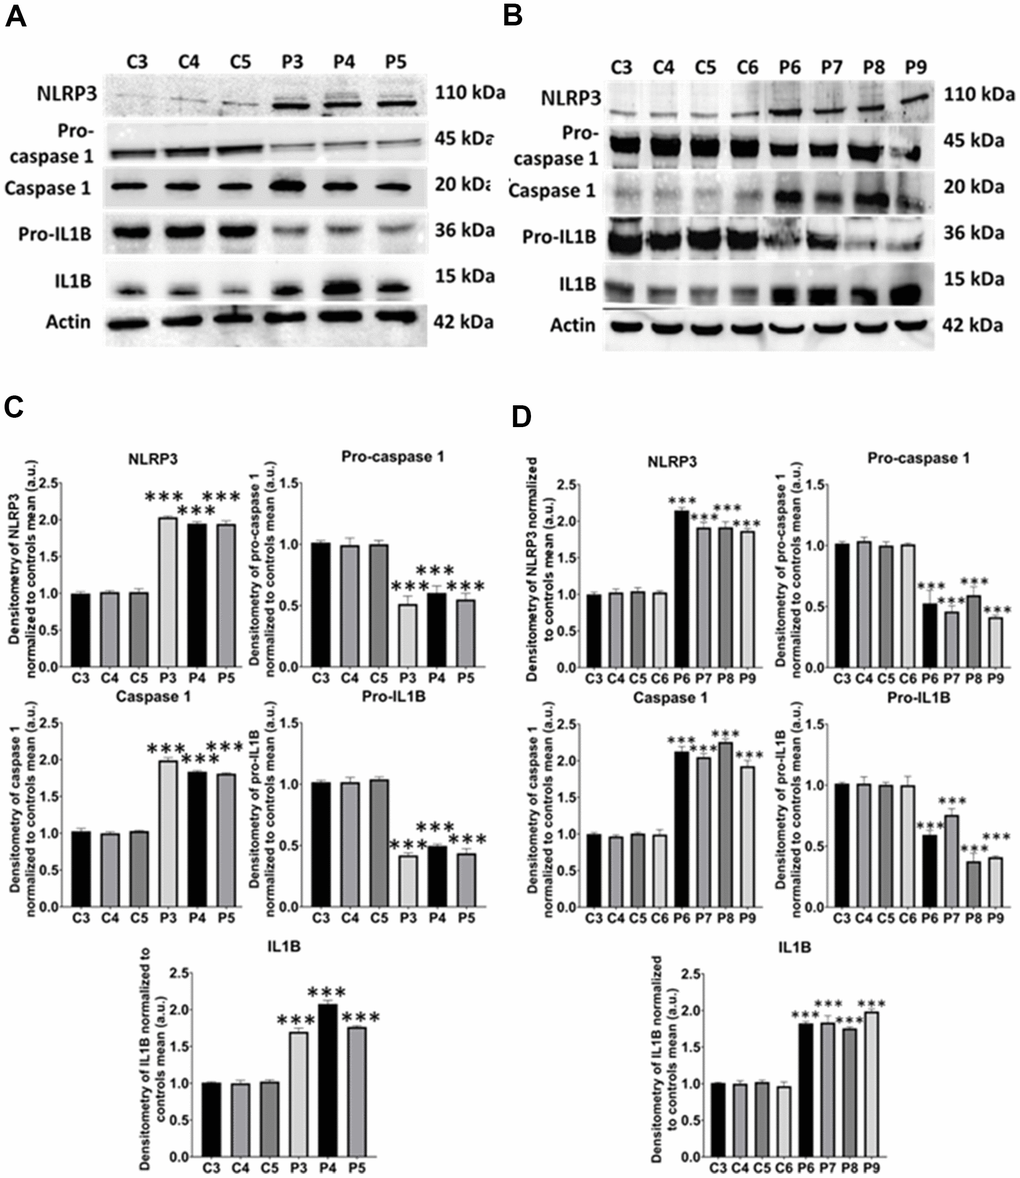
Figure 15.NLRP3 inflammasome analysis. (A) Immunoblotting analysis of proteins related to NLRP3 inflammasome in control (C3, C4, C5) and MS (P3, P4, P5) cells. Actin was used as the loading control. (B) Band densitometry of the Western Blot data normalized to the mean of controls and referred to actin levels. (C) Immunoblotting analysis of proteins related to NLRP3 inflammasome in control (C3, C4, C5, C6) and MS (P6, P7, P8, P9) cells. Actin was used as the loading control. (D) Band densitometry of the Western Blot data normalized to the mean of controls and referred to actin levels. Data represent the mean ± SD of three independent experiments. ***p-value < 0.0001 between control and MS fibroblasts.