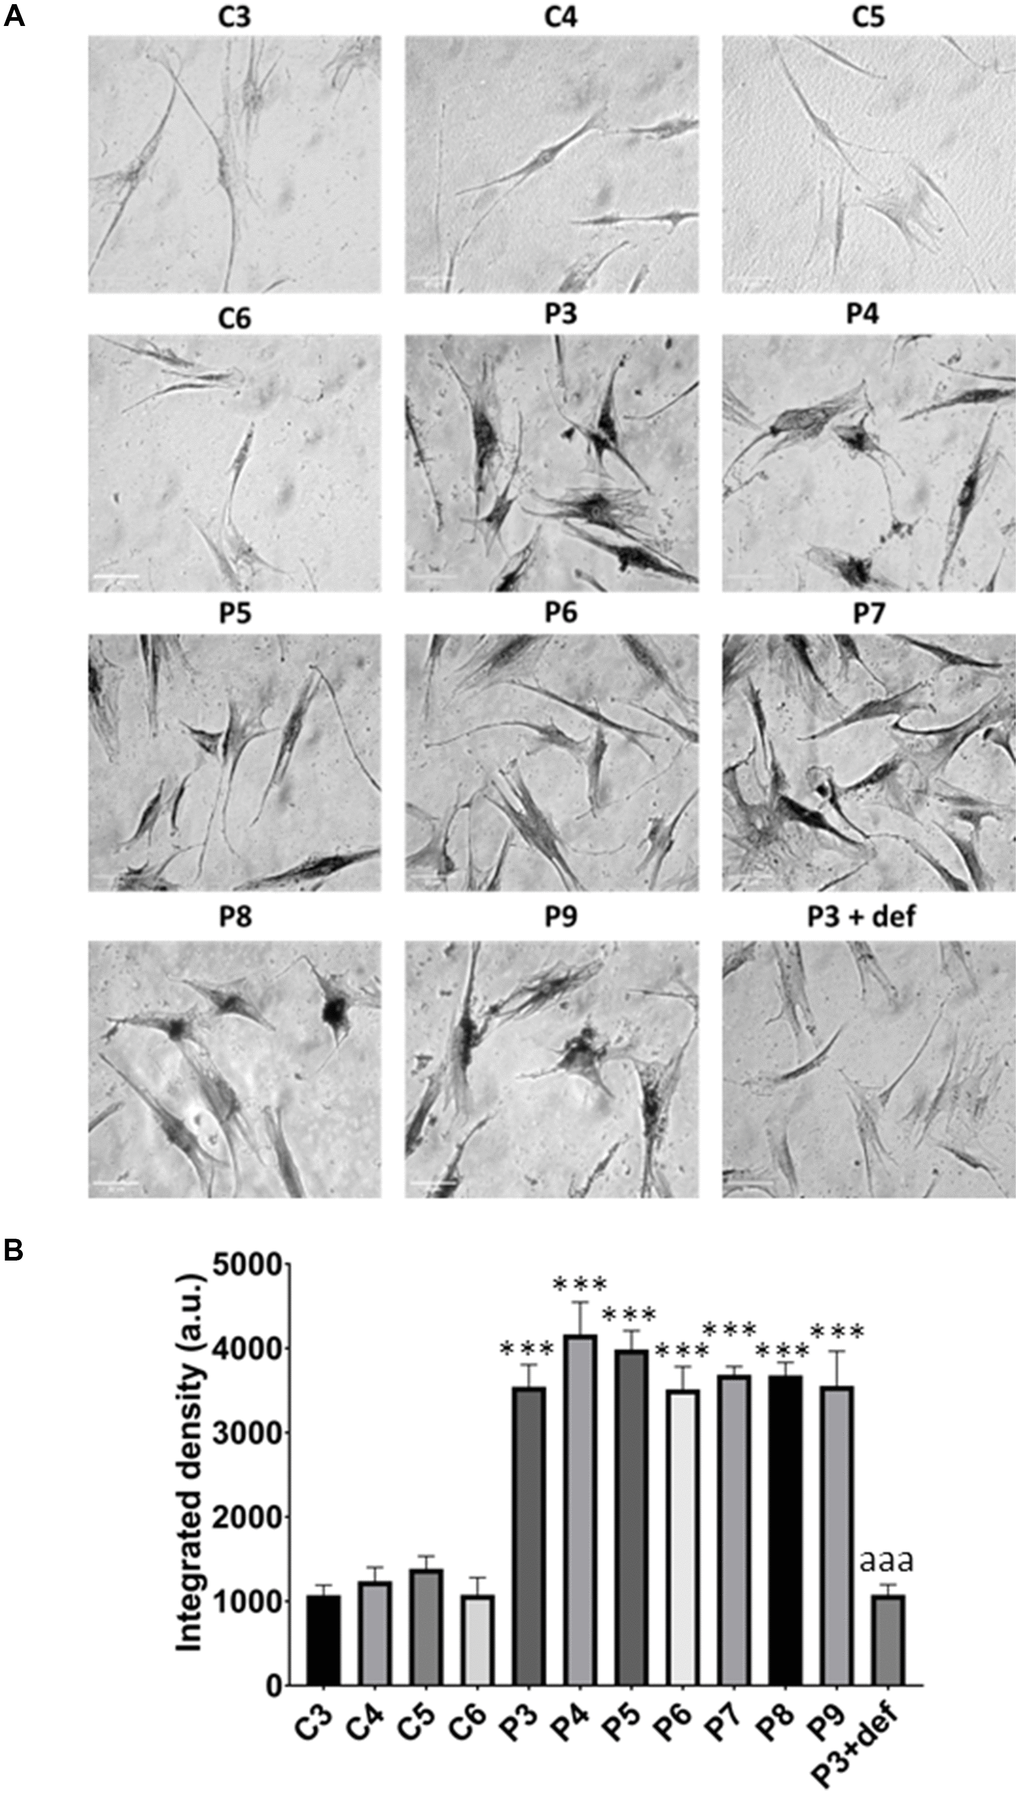
Figure 13.Lipofuscin accumulation. (A) Representative images of Sudan Black staining of control (C3,C4,C5,C6) and patients’ cells (P3, P4, P5, P6, P7, P8, P9). P3 treated with deferiprone at 100 μM (P3 + def) was used as a negative control. (B) Quantification of Sudan Black staining. Scale bar = 20 μm. Data represent the mean ± SD of three separate experiments. ***p-value < 0.0001 between control and MS fibroblasts. aaap-value < 0.0001 between untreated and deferiprone-treated P3 cells. a.u.: arbitrary units.