Submit an Article
Navigate
Home
Editorial Board
Editorial Policies
Current Volume
Archive
Scientific Integrity
Publication Ethics Statements
Interviews with Outstanding Authors
Newsroom
Sponsored Conferences
Podcast
Contact
Special Collections
Submit an Article
Online ISSN: 1945-4589
Research Paper
|
Volume 17, Issue 2
|
pp. 365–392
Mitochondrial dysfunction, iron accumulation, lipid peroxidation, and inflammasome activation in cellular models derived from patients with multiple sclerosis
Back to article
Figure 11
(11 of 15)
−
100%
+
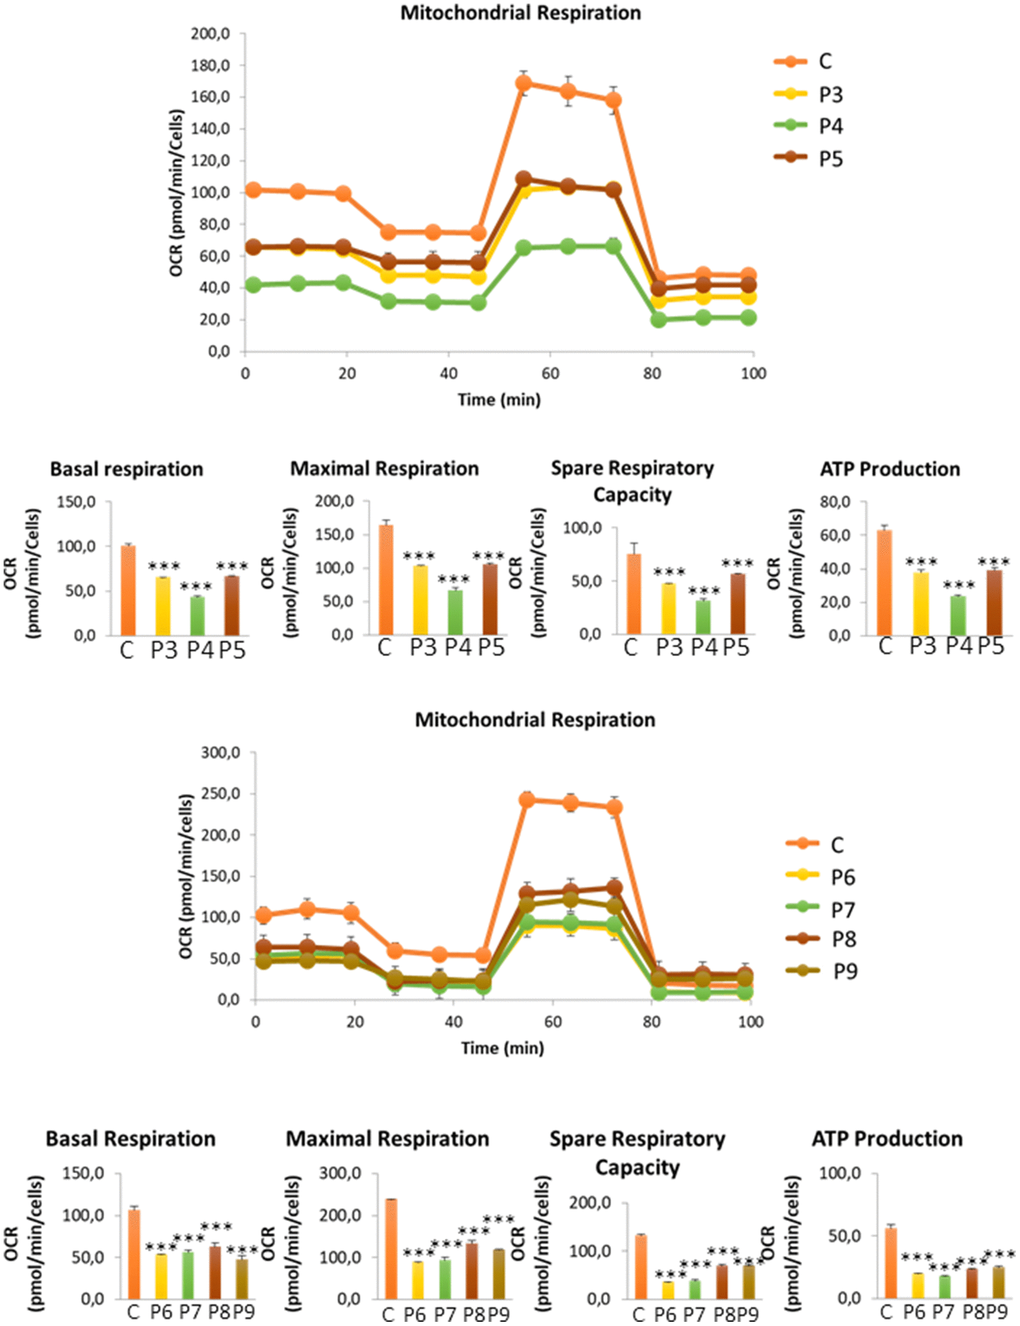
Figure 11.
Bioenergetics analysis of control (C3, C4, C5, C6) and MS (P3, P4, P5, P6, P7, P8, P9) cells.
Data represent the mean ± SD of three independent experiments.
***p-value < 0.0001
between control and MS fibroblasts.