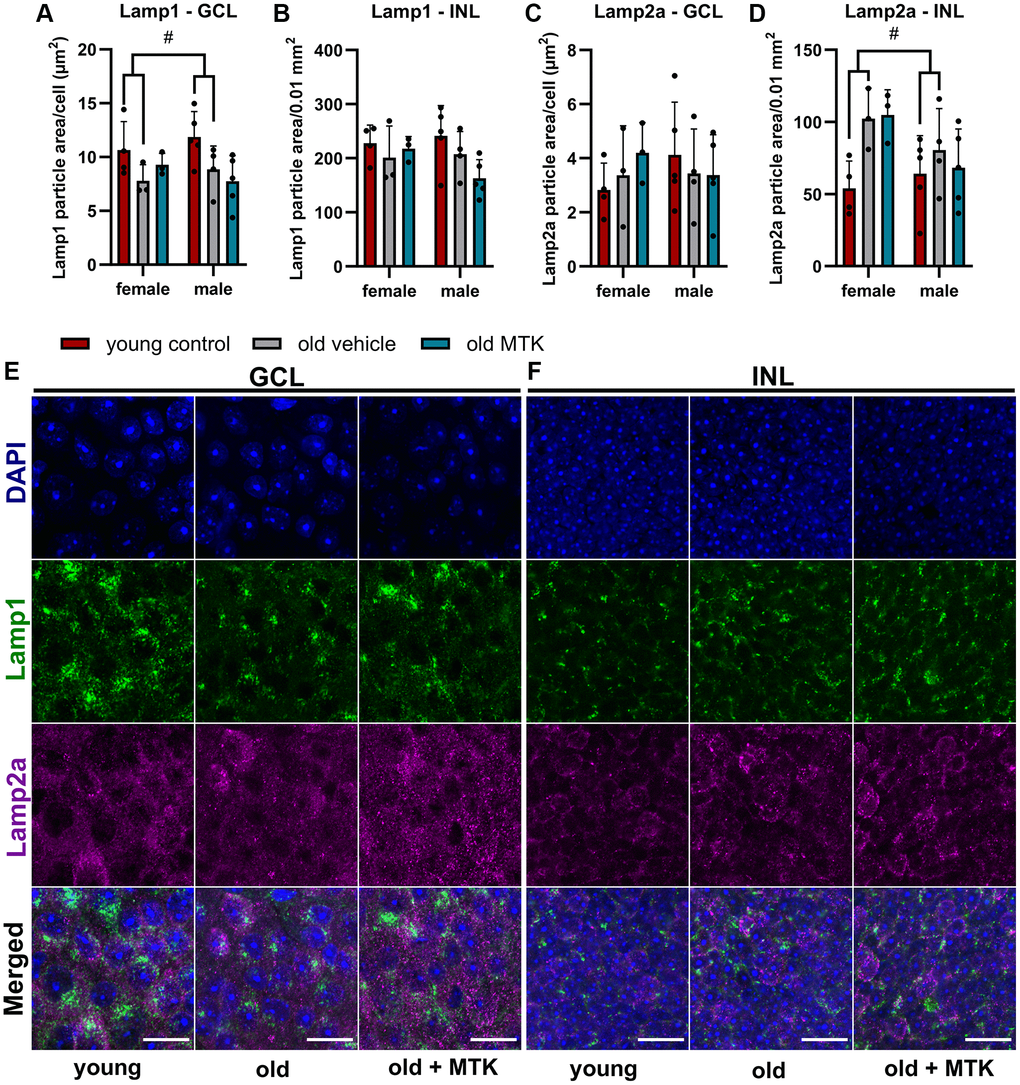
Figure 8.Labeling of Lamp1 and Lamp2a in the retinal GCL and INL of young untreated, vehicle-treated and MTK-treated old mice. Positive labeling was analyzed using ImageJ. Lamp1 particle area in the (A) GCL (area per cell) and (B) INL (per 0.01 mm2). Lamp2a particle area in the (C) GCL (area per cell) and (D) INL (0.01 mm2). Representative images of Lamp1 (green) and Lamp2a (magenta) labeling in the (E) GCL and (F) INL of young untreated, vehicle-treated and MTK-treated old mice. Scale bar images = 20 µm. The data are represented as bar graphs and scatter plots ± SDs, n = 3–5. Two-way ANOVA (main factors: group and sex) followed by a Dunnett multiple comparison test. #p < 0.05 young control vs. old vehicle-treated.