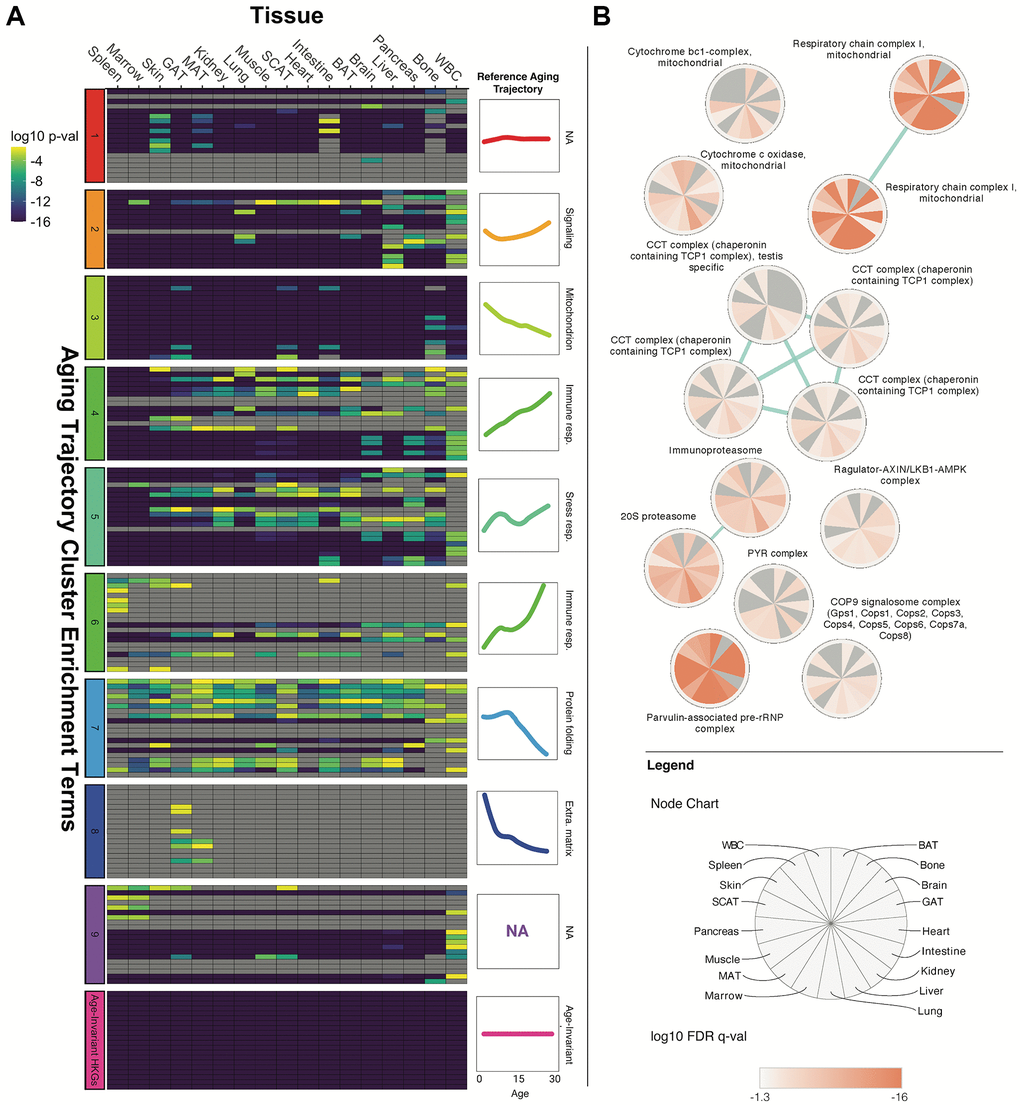
Figure 4.Age-invariant genes are enriched for age-dysregulated gene functions. (A) Tissue age-invariant genes are enriched for some of the same GO, KEGG and REACTOME terms that are also associated with clusters of age-dysregulated genes with linear and non-linear aging trajectories. Heatmap columns correspond to different tissues, while rows correspond to enrichment terms described in the dataset’s original publication by Schaum et al. [2]. The row clusters on the left of the heatmap and colored line-plots on the right of the heatmap correspond to 9 groups defined by Schaum et al. Age-invariant labels at the very bottom (pink) refer to age-invariant genes we identified for each tissue. Heatmap color corresponds to the Bonferroni-corrected p-value on a log10 scale from a Fisher's exact test quantifying enrichment. A version of this plot with term names can be found in Supplementary Figure 7A. An alternative analysis utilizing terms associated with hallmarks of aging found by Fraser et al. [39] can be found in Supplementary Figure 7B. (B) Tissue age-invariant genes are enriched for certain protein complexes. Each circular node corresponds to a protein complex, each slice within the node corresponds to a different tissue, and the coloration within slices reflects the log10 False Discovery Rate (FDR) q-value for that tissue. Non-significant FDR q-values (>0.05) are grey. The blue edges signify that the connected nodes have a significant overlap of genes represented.