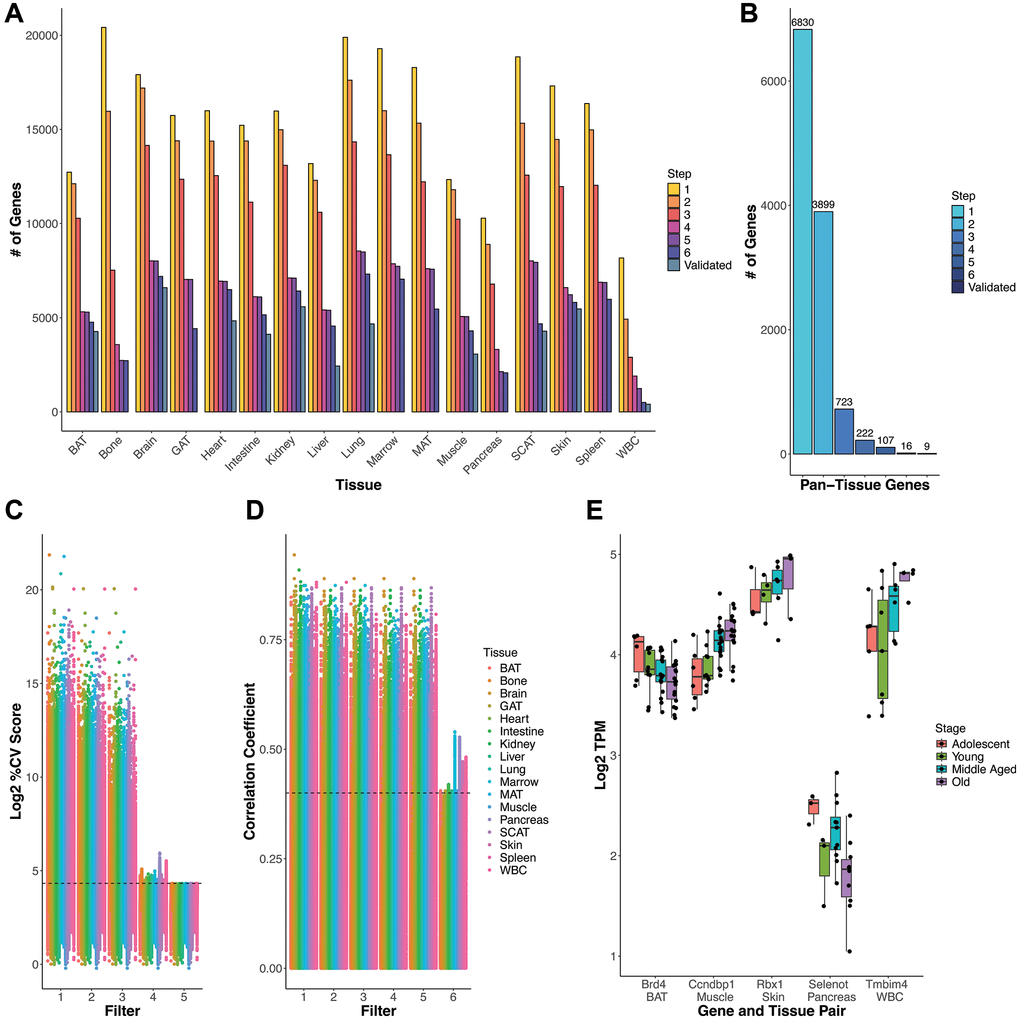
Figure 2.Gene selection process and rationale. (A) Gene count number remaining after each criteria/filter step for each tissue. (B) Count of genes present across all tissues at each step (e.g. pan-tissue) (C) % Coefficient of Variance (CV) for each gene calculated as SD/mean*100 distribution of log2 TPM gene expression values. Genes that satisfy every subsequent filter are plotted by the last filter applied. Filters 1–3 slowly decrease %CV and the cumulative effect of filters 1–4 generally results in a %CV of approximately 20% (marked by the dashed line). Filter 5 imposes a strict %CV <20% requirement for all tissue-gene pairs. (D) Age information must be included in exclusion criteria as low variation genes can still have a high correlation with age. Filter 6 (Spearman correlation p-value based removal) removes highly age-correlated genes. Dashed line corresponds to a correlation coefficient (y-axis) of 0.4, which for most tissues corresponds to a significant correlation with p = 0.05. Exact CV and age correlation information is found in Supplementary Table 2, in case readers wish to utilize other cutoffs in selecting RGs. (E) Log2 TPM (y-axis) values by life stage (color) for specific gene-tissue pairs (x-axis) for genes that satisfy filters 1–5, but are eliminated by filter 6. Boxplot line represents the group median while lower and upper limits of the boxplot correspond to the first (25%) and third (75%) quartiles.