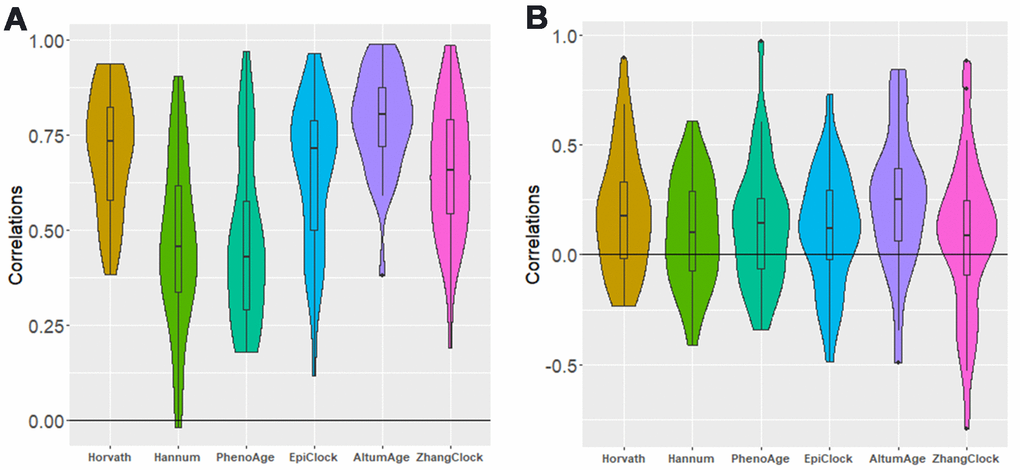
Figure 3.Distribution of between-tissue correlations for each clock, for all possible pairs of tissue types. (A) not adjusted for age (B) adjusted for age. Each of the five distributions shown (in both panels) has a mean greater than zero (P<0.05).
Figure 3 — Characterization of DNA methylation clock algorithms applied to diverse tissue types | Aging