Submit an Article
Navigate
Home
Editorial Board
Editorial Policies
Current Volume
Archive
Scientific Integrity
Publication Ethics Statements
Interviews with Outstanding Authors
Newsroom
Sponsored Conferences
Podcast
Contact
Special Collections
Submit an Article
Online ISSN: 1945-4589
Research Paper
|
Volume 16, Issue 21
|
pp. 13392–13408
Pan-cancer analysis identifies the oncogenic role of
CCNE1
in human cancers
Back to article
Figure 3
(3 of 7)
−
100%
+
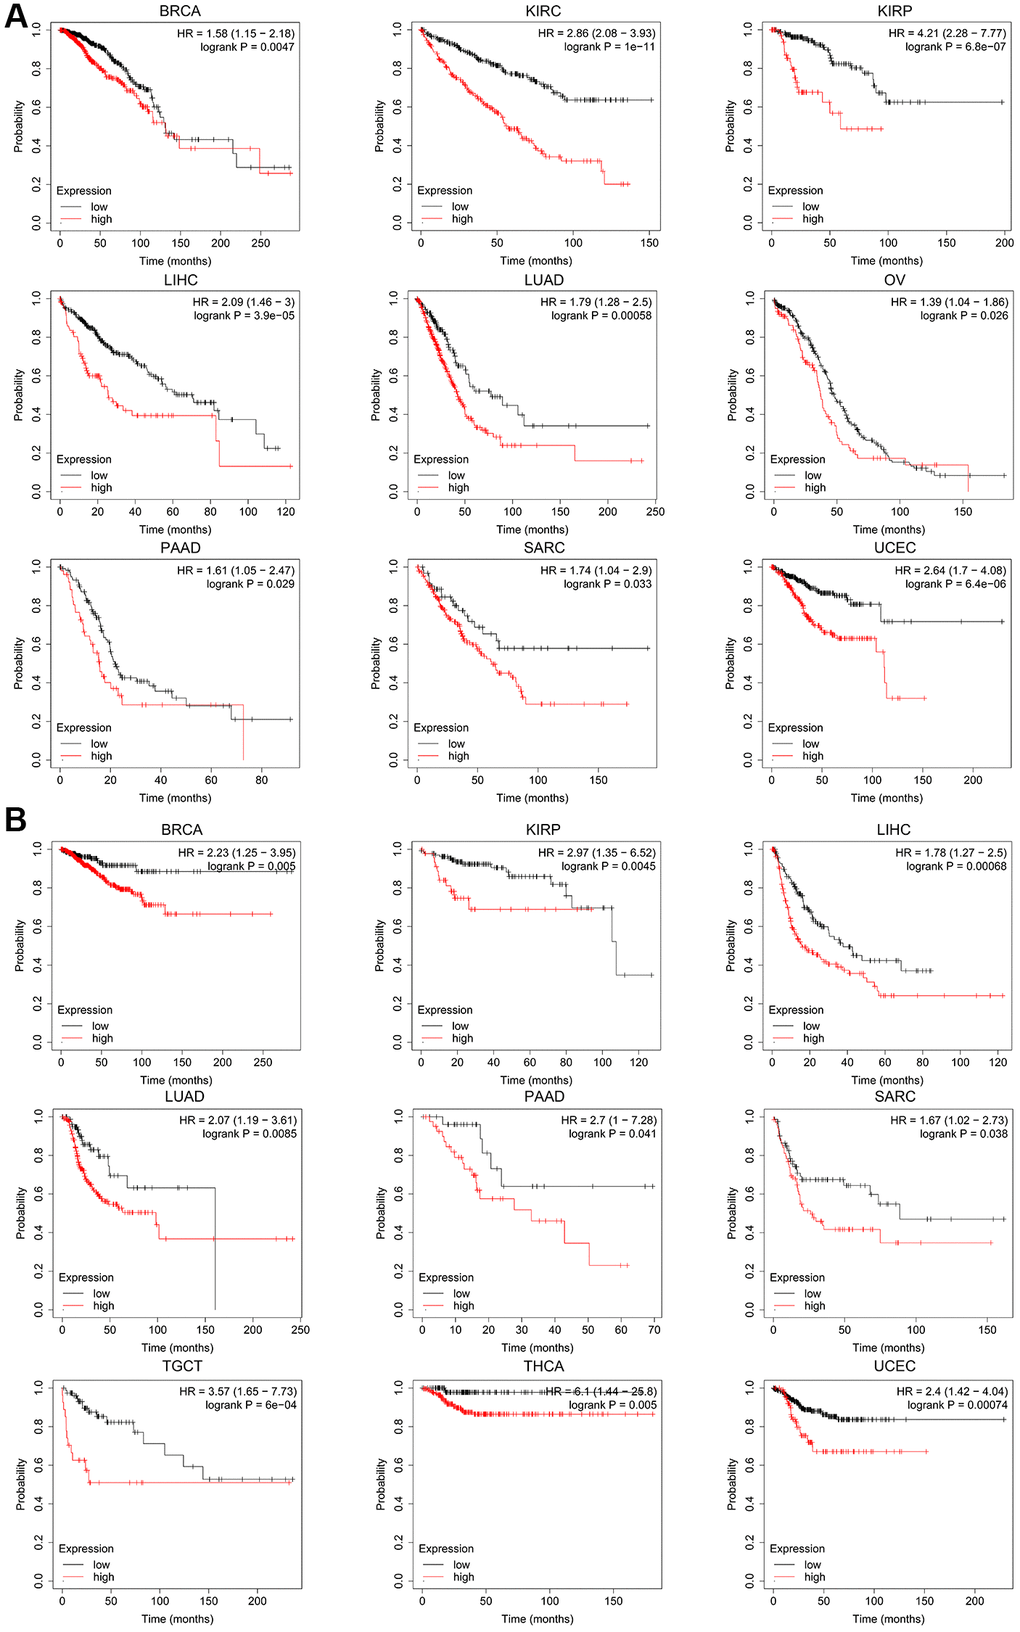
Figure 3.
The Kaplan-Meier plotter reflecting
CCNE1
expression and (
A
) overall survival and (
B
) relapse-free survival. Tumors with higher
CCNE1
expression are indicated in red, while those with lower expression are shown in black.