Submit an Article
Navigate
Home
Editorial Board
Editorial Policies
Current Volume
Archive
Scientific Integrity
Publication Ethics Statements
Interviews with Outstanding Authors
Newsroom
Sponsored Conferences
Podcast
Contact
Special Collections
Submit an Article
Online ISSN: 1945-4589
Research Paper
|
Volume 16, Issue 21
|
pp. 13271–13287
Supplementation with nicotinamide limits accelerated aging in affected individuals with cockayne syndrome and restores antioxidant defenses
Back to article
Figure 1
(1 of 6)
−
100%
+
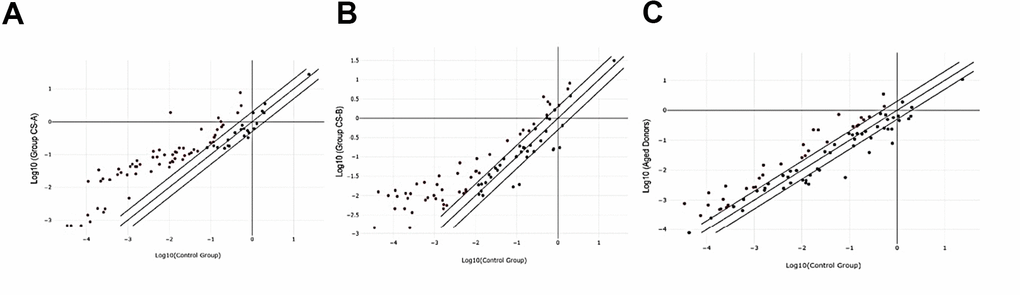
Figure 1.
Scatter plot of differentially expressed genes in the 3 different groups normalized to healthy controls.
(
A
) CS-A, (
B
) CS-B, (
C
) Elderly group.