Submit an Article
Navigate
Home
Editorial Board
Editorial Policies
Current Volume
Archive
Scientific Integrity
Publication Ethics Statements
Interviews with Outstanding Authors
Newsroom
Sponsored Conferences
Podcast
Contact
Special Collections
Submit an Article
Online ISSN: 1945-4589
Research Paper
|
Volume 16, Issue 21
|
pp. 13340–13355
Identification of the m6A/m5C/m1A methylation modification genes in Alzheimer’s disease based on bioinformatic analysis
Back to article
Figure 8
(8 of 11)
−
100%
+
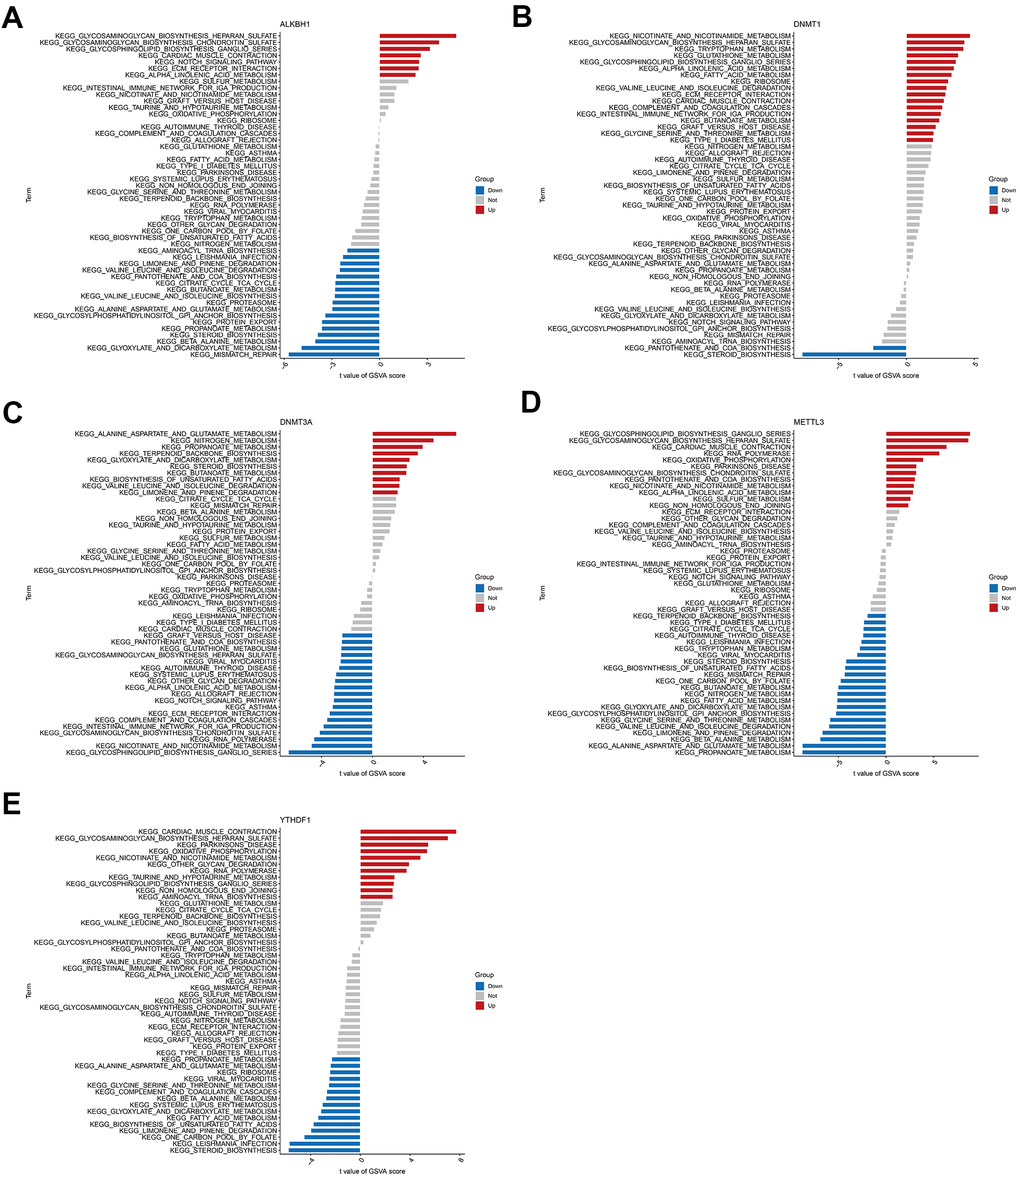
Figure 8.
High and low expression groups per the expression levels of each marker gene combined with GSVA.
(
A
) ALKBH1. (
B
) DNMT1. (
C
) DNMT3A. (
D
) METTL3. (
E
) YTHDF1.