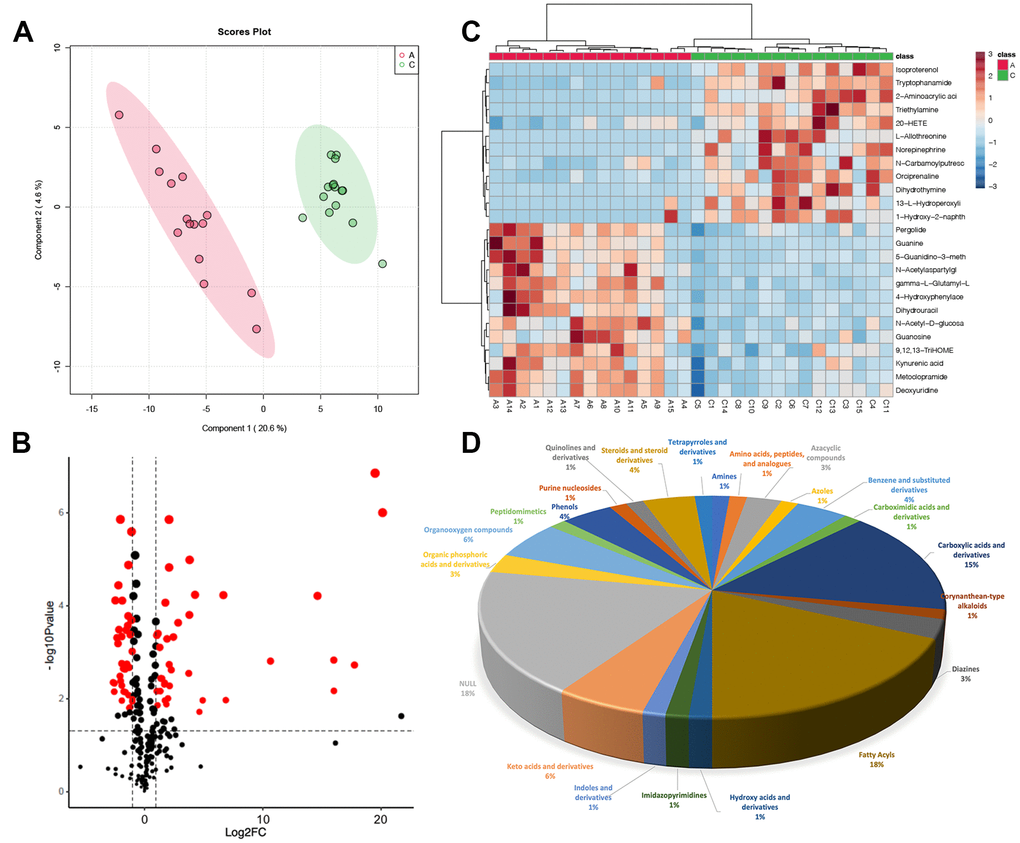
Figure 3.Metabolic differences in FF between group A and group C. (A) PLSDA score plot; (B) volcano plot of differential metabolites, each point represents a differential metabolite, the horizontal coordinate represents the log2 fold change of the metabolite, and the vertical coordinate represents the P-value (log10 transformed); (C) heatmap of top 25 differential metabolites; (D) sub-classification of differential metabolites.