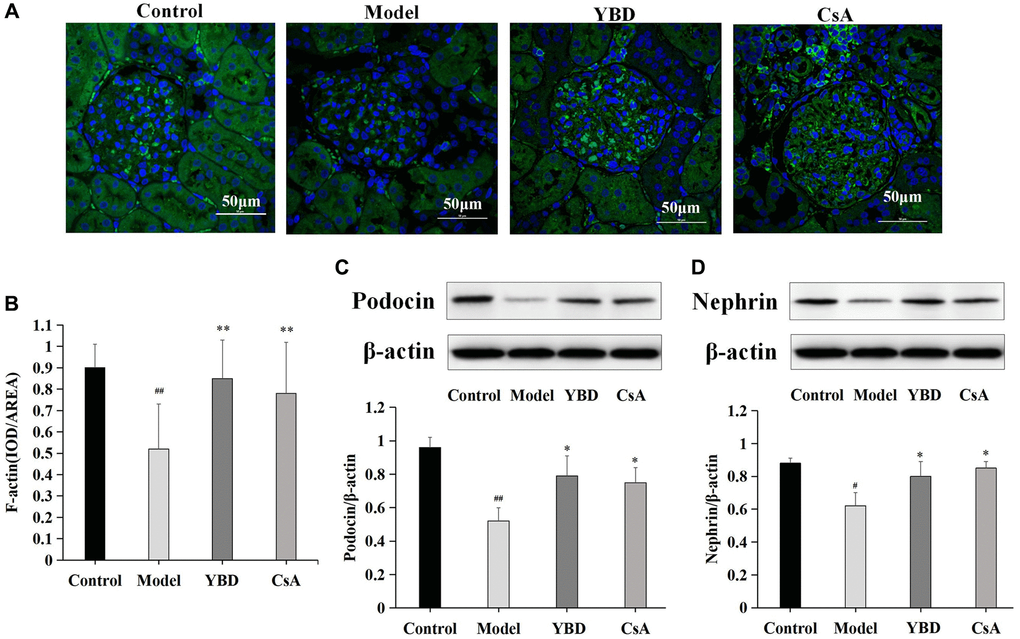
Figure 13. (A) F-actin in renal cortex tissues from different groups was shown by confocal microscopy (magnification × 600). Green staining showed positive expression of F-actin, and blue staining showed positive expression of cell nucleus. (B) The area of F-actin in different groups. (C, D) Western blotting analysis for the protein expression levels of podocin and nephrin in renal cortex tissues from different groups. As an internal control respectively, β-actin was used to calculate the quantification of protein. Data were expressed as mean ± SD, n = 6. Vertical bars represent the standard deviation. #p < 0.05 and ##p < 0.01 versus control group; *p < 0.05 and **p < 0.01 versus model group.