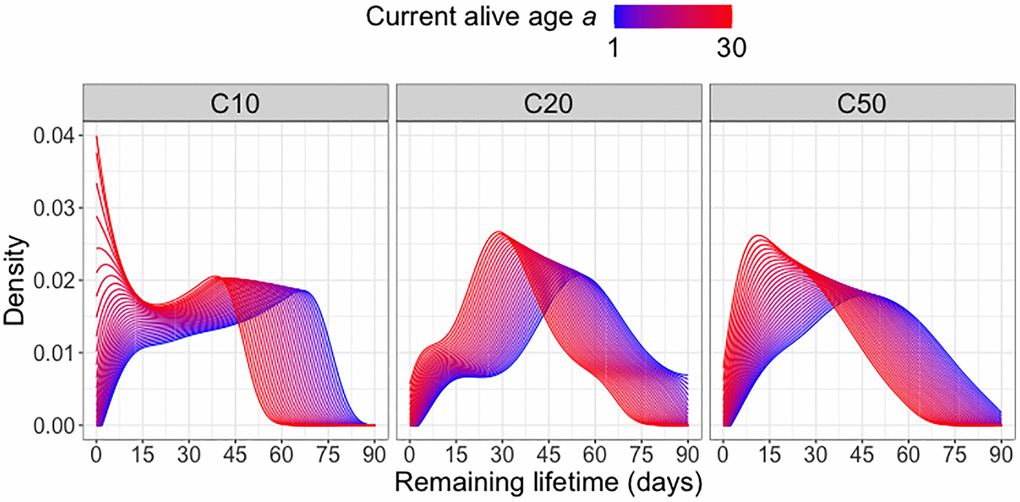
Figure 1.Remaining lifetime distribution for different diet groups. Predicted remaining lifetime distributions (visualized as densities) at different values of current alive age a, where a varies from a = 1 (blue) to a = 30 (red), for three different diet groups C10, C20, C50 (yeast hydrolysate content 10%, 20% and 50%), using global Fréchet regression (4) (see Appendix).