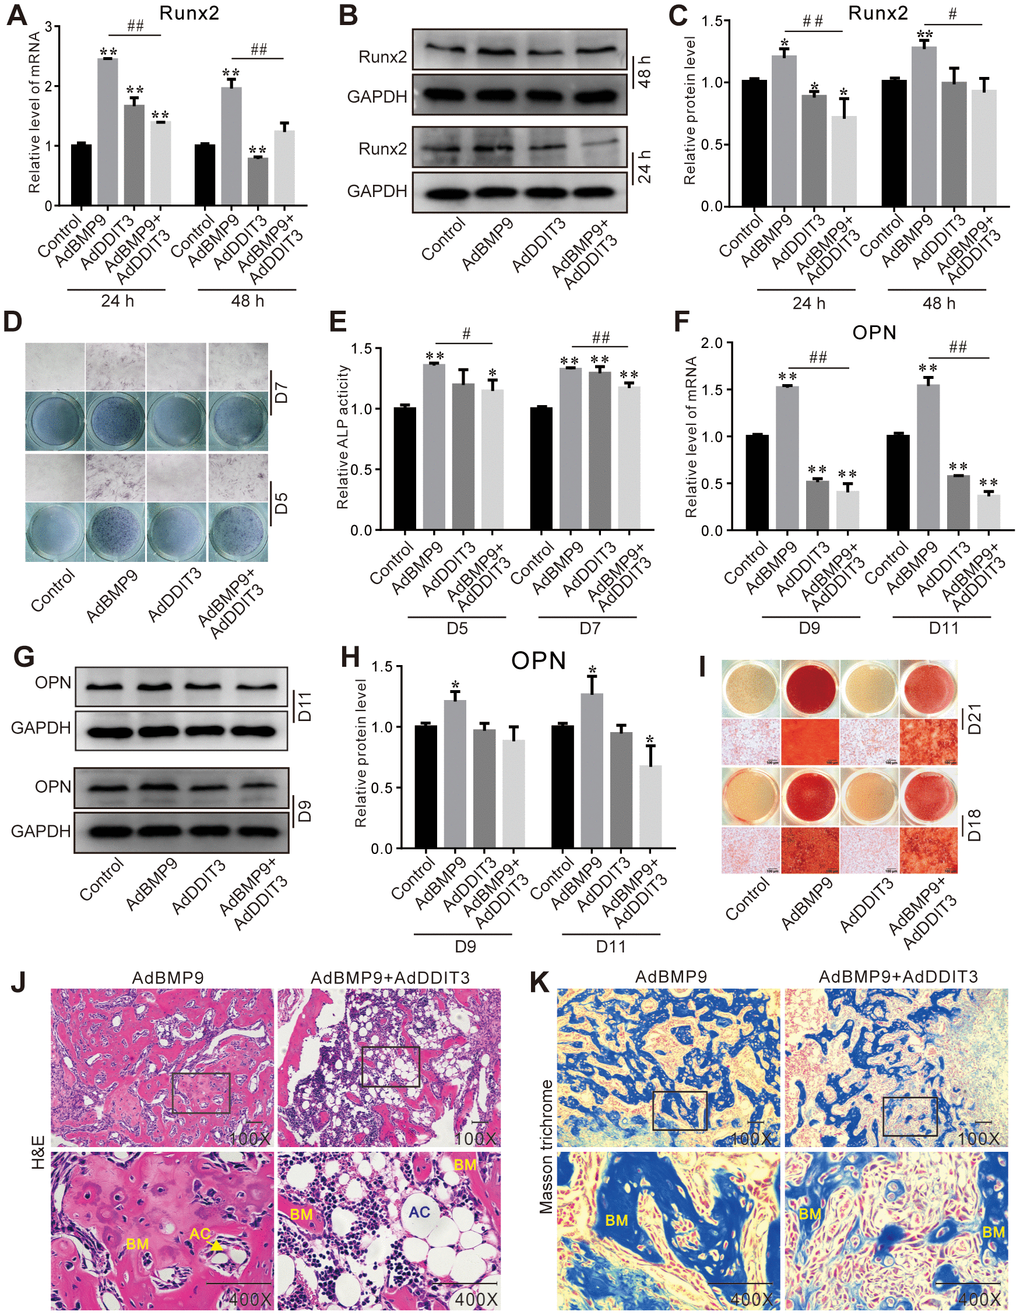
Figure 2.Effects of DDIT3 on the BMP9-induced osteogenic markers in C3H10T1/2 cells. (A) Real-time PCR results show the effect of DDIT3 on the mRNA expression of Runx2 induced by BMP9. (B) Western blot assay results show the effect of DDIT3 on protein level of Runx2 induced by BMP9. (C) Quantitative results of Western blot assay show the effect of DDIT3 on protein level of Runx2 induced by BMP9. (D) ALP staining results show the effect of DDIT3 on the ALP activity induced by BMP9 on day 5 or day 7. (E) Quantitative results of ALP staining show the effect of DDIT3 on the ALP activity induced by BMP9 on day 5 or day 7. (F) Real-time PCR results show the effect of DDIT3 on the mRNA expression of OPN induced by BMP9 on day 9 and day 11. (G) Western blot assay results show the effect of DDIT3 on the protein level of OPN induced by BMP9 on day 9 and day 11. (H) Quantitative results of Western blot assay show the effect of DDIT3 on the protein level of OPN induced by BMP9 on day 9 and day 11. (I) Alizarin red S staining results show the effect of DDIT3 on matrix mineralization induced by BMP9 on day 18 and day 21. (J) H&E staining results show the effect of DDIT3 on the bone formation induced by BMP9 (upper panel bar is 50 μm, lower panel bar is 200 μm; lower panel shows the detail about the part of the rectangle; BM: bone matrix, AC: adipocyte). (K) Masson‘s trichrome staining results show the effect of DDIT3 on the bone formation induced by BMP9 (upper panel bar is 50 μm, lower panel bar is 200 μm; lower panel shows the detail about the part of the rectangle; BM: bone matrix). Compared with the control group, “*” p <0.05, “**” p <0.01; compared with the BMP9 group, “#” p <0.05, “##” p<0.01. All results were repeated in three independent experiments.