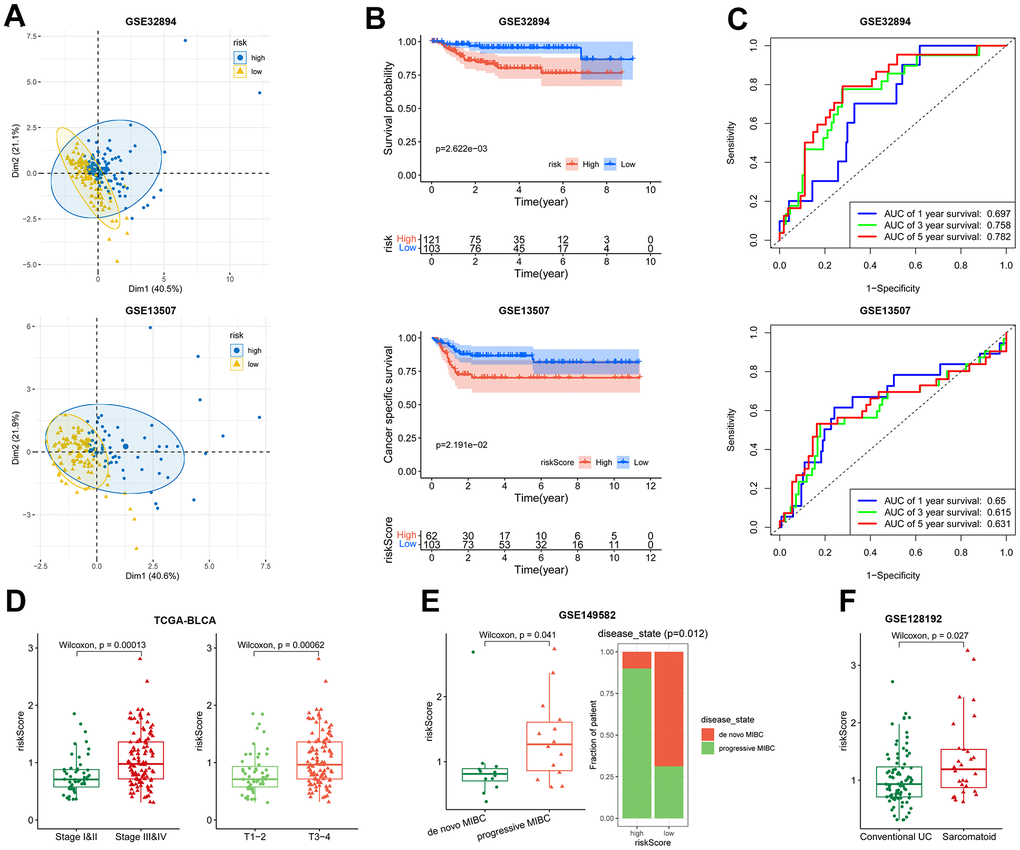
Figure 4.Association of the risk model with overall survival and disease severity. (A–C) The PCA analysis map, Kaplan-Meier survival analysis, and ROC curves of the high- and low-risk patients in GSE32894 (up) and GSE13507 (down) datasets. (D) Plot of risk score according to the stage (left) and T (right) in TCGA-BLCA dataset. (E) Patient’s risk score in de novo MIBC vs. progressive MIBC (left), and composition of the two disease states in high- and low-risk patients (right) in GSE149582 dataset. (F) Patient’s risk score in conventional UC vs. sarcomatoid carcinoma in GSE128192 dataset.