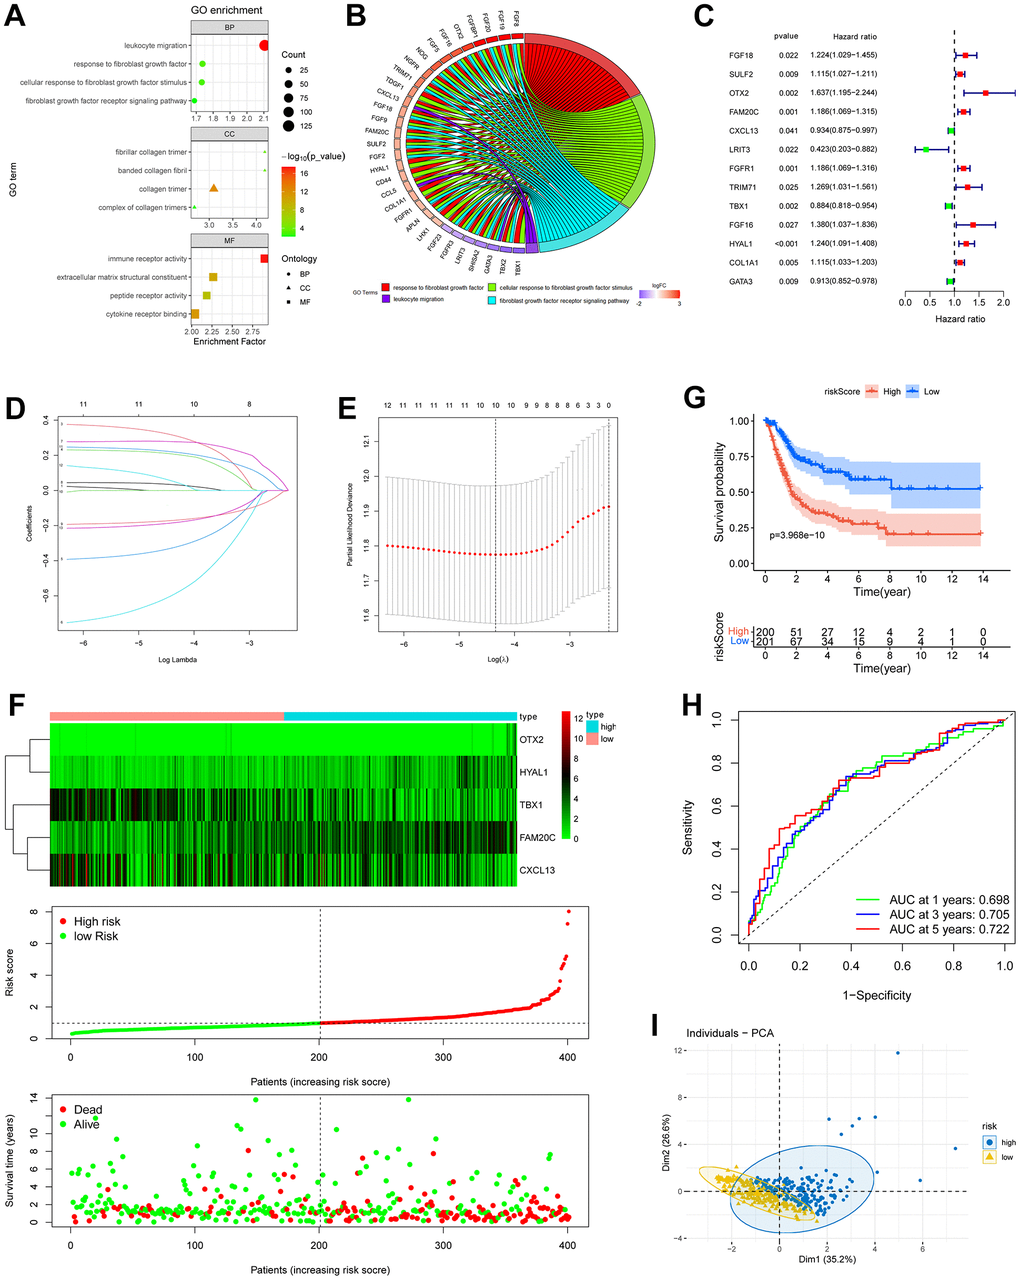
Figure 3.Construction of risk model based on fibroblast growth signal difference. (A) Bubble plot of GO enrichment of fibroblasts-related DEGs between C1 and C2 subgroups. (B) GO chord diagram showed the potential biological processes of the DEGs. (C) Forest plot of the survival-related DEGs obtained by univariate Cox regression, p < 0.05. (D, E) The 13 prognostic DRGs were fed into Lasso regression model. (F) Expression profiles of the risk genes (up), distribution of risk score (middle) and survival status (down) of BLCA patients. (G) Kaplan-Meier survival analysis of BLCA patients based on risk score. (H) ROC curves demonstrated the predictive prognostic value of risk score at 1, 3 and 5 years. (I) PCA analysis map of the high- and low-risk groups.