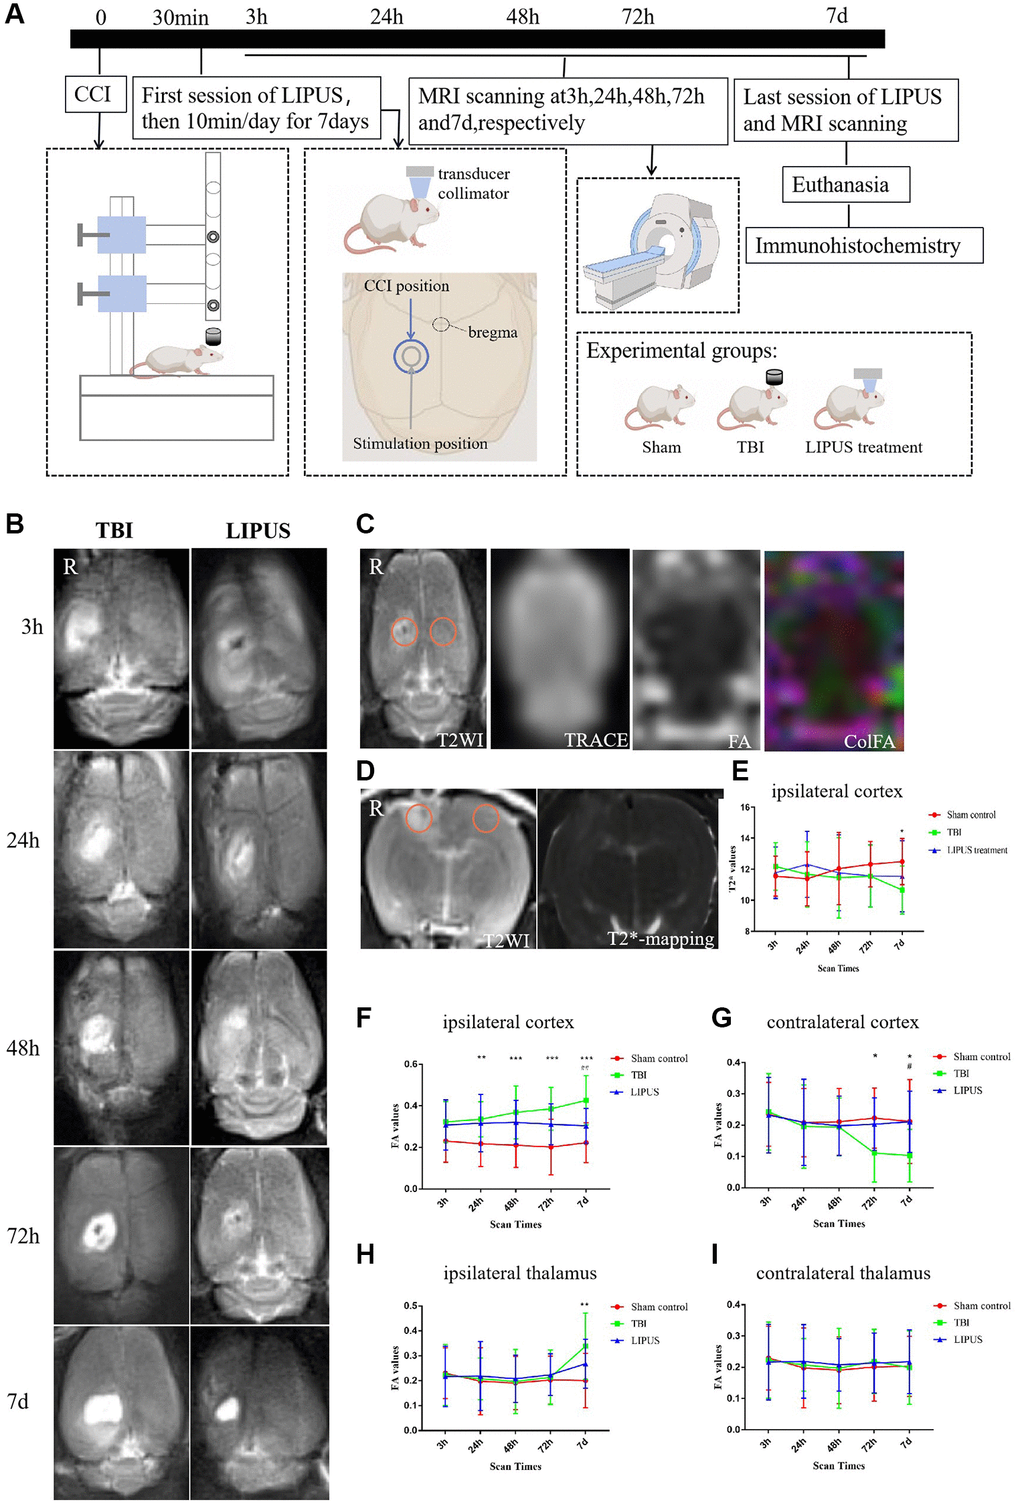
Figure 1.(A) Experimental design. Using the CCI surgical operation as the zero point, LIPUS treatment was administered 30 minutes after trauma and then for 10 minutes at a fixed time every day for 7 days. In the schematic diagram of rat skull and brain shown in the figure, the blue circle represents the CCI location, and the gray circle represents the LIPUS treatment location. MRI scans were performed at 3 h, 24 h, 48 h, 72 h, and 7d post-injury. After the last LIPUS treatment and MRI scan, the rats were sacrificed, and their brains were used for immunohistochemistry. The experiment was divided into three groups: Sham, TBI, and LIPUS treatment group. (B) Transverse imaging of rat brain at different time points, represents the degree of brain injury in TBI and LIPUS groups. The damaged area is a high signal area of the right cortex (above the hippocampus). As shown, the area of high signal area on tra-T2WI is smaller in the LIPUS treatment group compared to the TBI. (C) ROI selection method for quantitative measurement of cortical FA values. Freehand ROIs were carefully matched with cor-T2WI images as reference images. The FA value of the bilateral thalamus was measured by the same method. (D) ROI selection method for quantitative measurement of cortical T2* values. Freehand ROIs were carefully matched with tra-T2WI images as reference images. (E) Trends of T2* values of TBI, LIPUS treatment and Sham Control groups in the injured ipsilateral cortex. The results showed that on the 7th day after trauma, the T2* values were decreased in the TBI group and significantly different from the Sham group. Two-way repeated measures ANOVA, followed by Tukey’s post hoc. *P < 0.05, Sham control vs. TBI. Data are Mean ± SD. (F, G) Trends of FA values of TBI, LIPUS treatment and Sham groups in the injured ipsilateral cortex (F) and the contralateral cortex (G). FA values in the TBI group showed a gradual increase, reaching a peak at 7d, while FA values in the LIPUS treatment group changed relatively flat (F). What’s more, FA values reached the lowest on the 7th day in the contralateral cortex (G). Two-way repeated measures ANOVA, followed by Tukey’s post hoc. **P < 0.01, ***P < 0.001, Sham control vs. TBI. #P < 0.05, TBI vs. LIPUS treatment. Data are Mean ± SD. (H, I) Trends of FA values of TBI, LIPUS treatment and Sham groups in the injured ipsilateral thalamus (H) and the contralateral thalamus (I). On the 7th day, there was a significant difference between the sham and TBI groups in the injured ipsilateral thalamus (H), while no significant difference among groups in the contralateral thalamus (I). Two-way repeated measures ANOVA, followed by Tukey’s post hoc. **P < 0.01, Sham vs. TBI. Data are Mean ± SD.