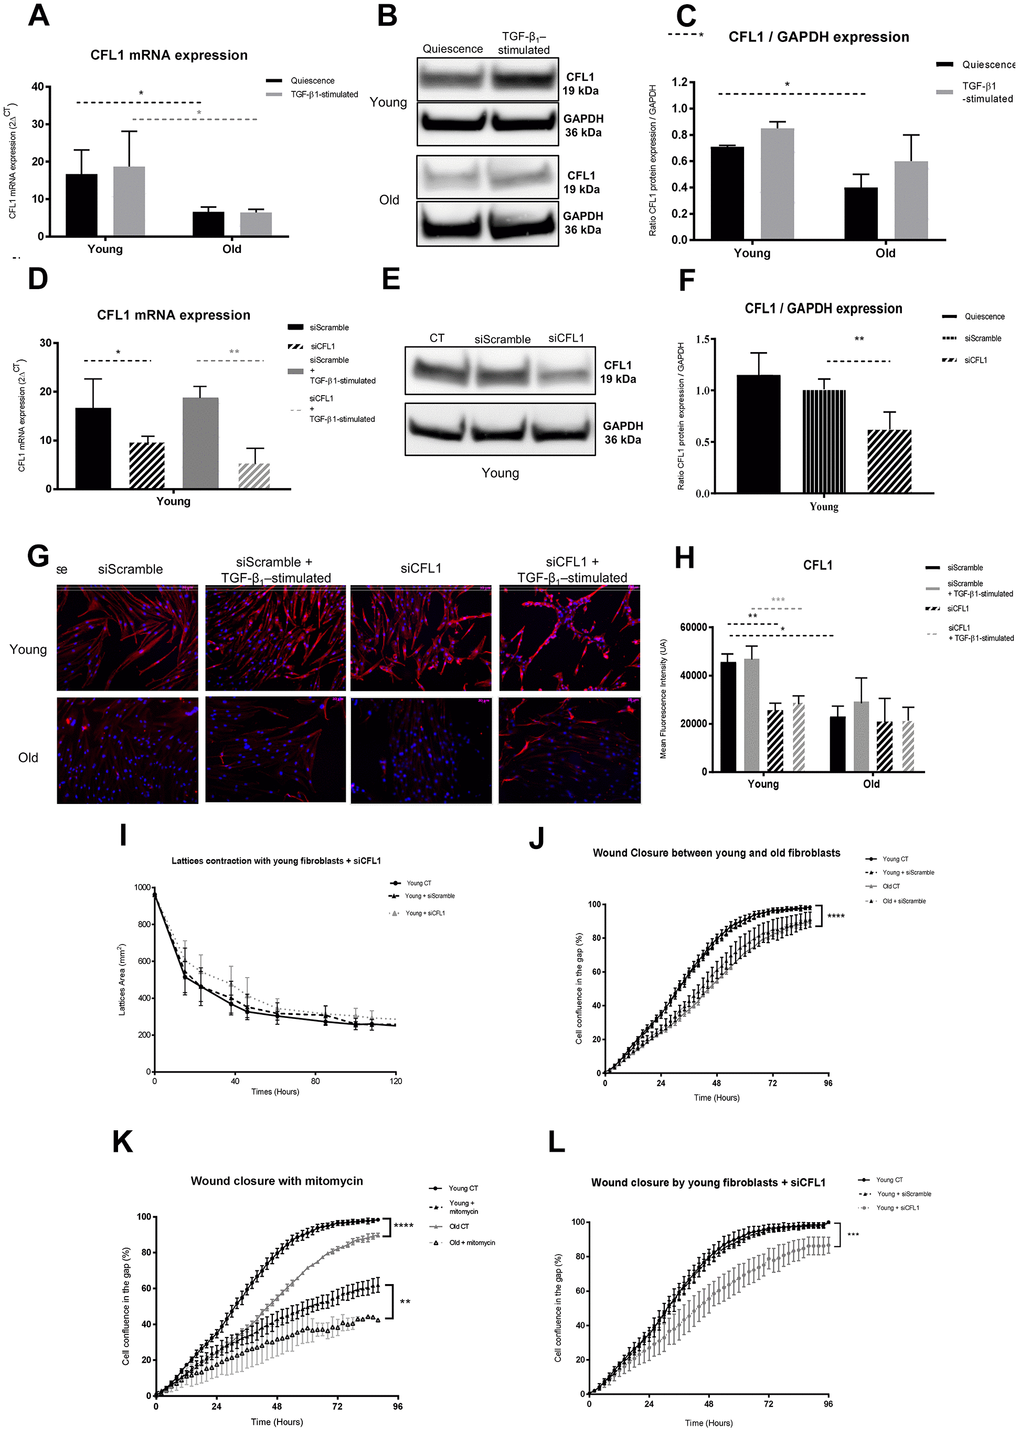
Figure 3.CFL1 analysis. (A) mRNA CFL1 expression (RT-qPCR) of fibroblasts in quiescence or after 24h of TGF-β-1 stimulation (Mean±SEM, n= 6 for young and old cells); (B) one representative western blot of CFL1 and GAPDH expression and (C) mean (±SD) quantification of CFL1/GAPDH ratio expression in quiescence or after a 24h-TGF-β-1 stimulation of young or old fibroblasts (n=3 per type); (D) mRNA expression quantified by RT-qPCR after transfection with specific siRNA for CFL1 (siCFL1) or with Scramble siRNA (siScramble), in quiescence or after a 24h-TGF-β-1 stimulation (Mean±SD, n=6 per type); (E) after transfection of young fibroblasts with specific siCFL1 or with siScramble, one representative western blot of CFL1 and GAPDH expression and (F) mean WB quantification of CFL1/GAPDH ratio expression (Mean±SD, n=3); (G) one representative immunofluorescence staining after transfection with specific siCFL1 or with siScramble of one representative young and one old fibroblast population, either in quiescence or after a 24h-TGF-β-1 stimulation and (H) in the same conditions, mean quantification of immunofluorescence staining from young or old fibroblasts (Mean±SD, n=6); (I) collagen gel contraction (lattice) of young fibroblasts either from control cultures or after transfection with specific siCFL1 or with siScramble during 120h (Mean±SD, n=6); (J) wound closure over 96h as measured by % of cell confluency for analysis of migration of young control fibroblasts (CT) or after transfection with siCFL1 or siScramble siRNA (Mean ±SD, n=6); (K) wound closure over 96h as measured by % of cell confluency for comparison of migration between young and old fibroblasts (Mean ±SD, n=6 per cell type); (L) wound closure over 96h as measured by % of cell confluency for analysis of migration with or without mitomycin-C inhibitor of young and old fibroblasts (Mean ±SD, n=6 per cell type). p-value *<0.05, **<0.01, ***<0.001.