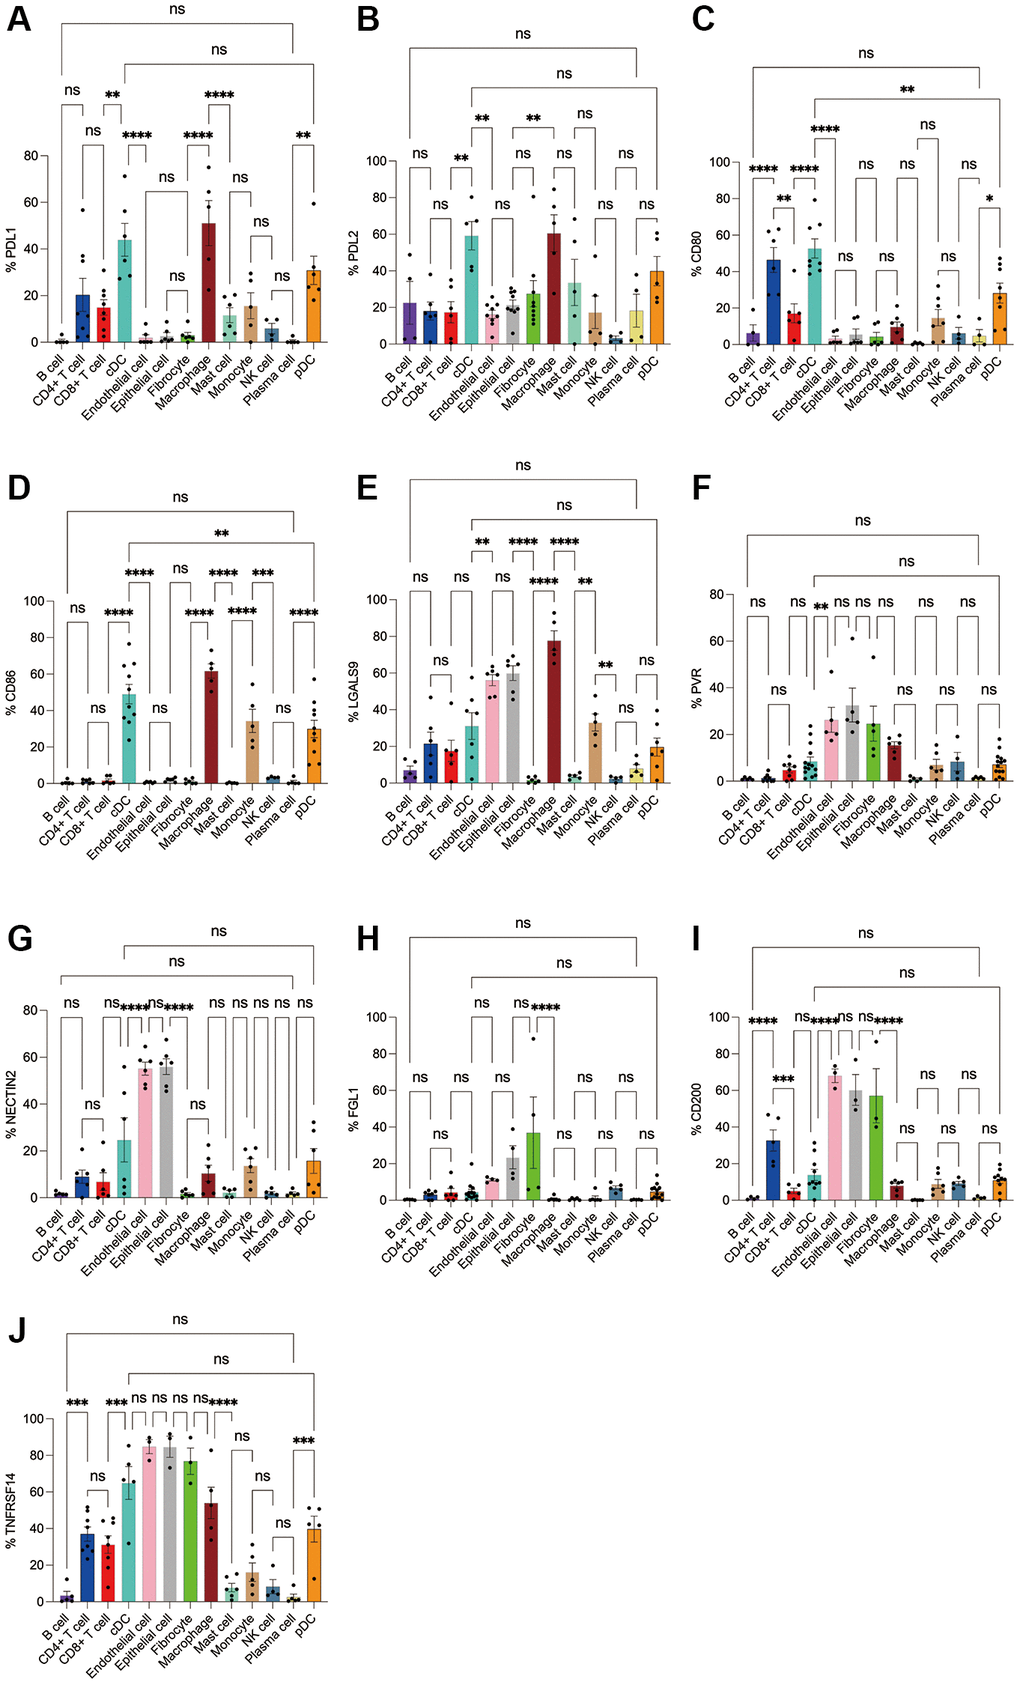
Figure 9.Flow cytometry analysis of the differences in the expression proportions of 10 immune checkpoint ligands in 13 cell subsets in human colorectal cancer. (A) Flow cytometry analysis of the expression ratio of PDL1 in 13 cell subsets; (B) Flow cytometry analysis of the expression ratio of PDL2 in 13 cell subsets; (C) Flow cytometry analysis of the expression ratio of CD80 in 13 cell subsets; (D) Flow cytometry analysis of the expression ratio of CD86 in 13 cell subsets; (E) Flow cytometry analysis of the expression ratio of LGALS9 in 13 cell subsets; (F) Flow cytometry analysis of the expression ratio of PVR in 13 cell subsets; (G) Flow cytometry analysis of the expression ratio of NECTIN2 in 13 cell subsets; (H) Flow cytometry analysis of the expression ratio of FGL1 in 13 cell subsets; (I) Flow cytometry analysis of the expression ratio of CD200 in 13 cell subsets; (J) Flow cytometry analysis of the expression ratio of TNFRSF14 in 13 cell subsets.