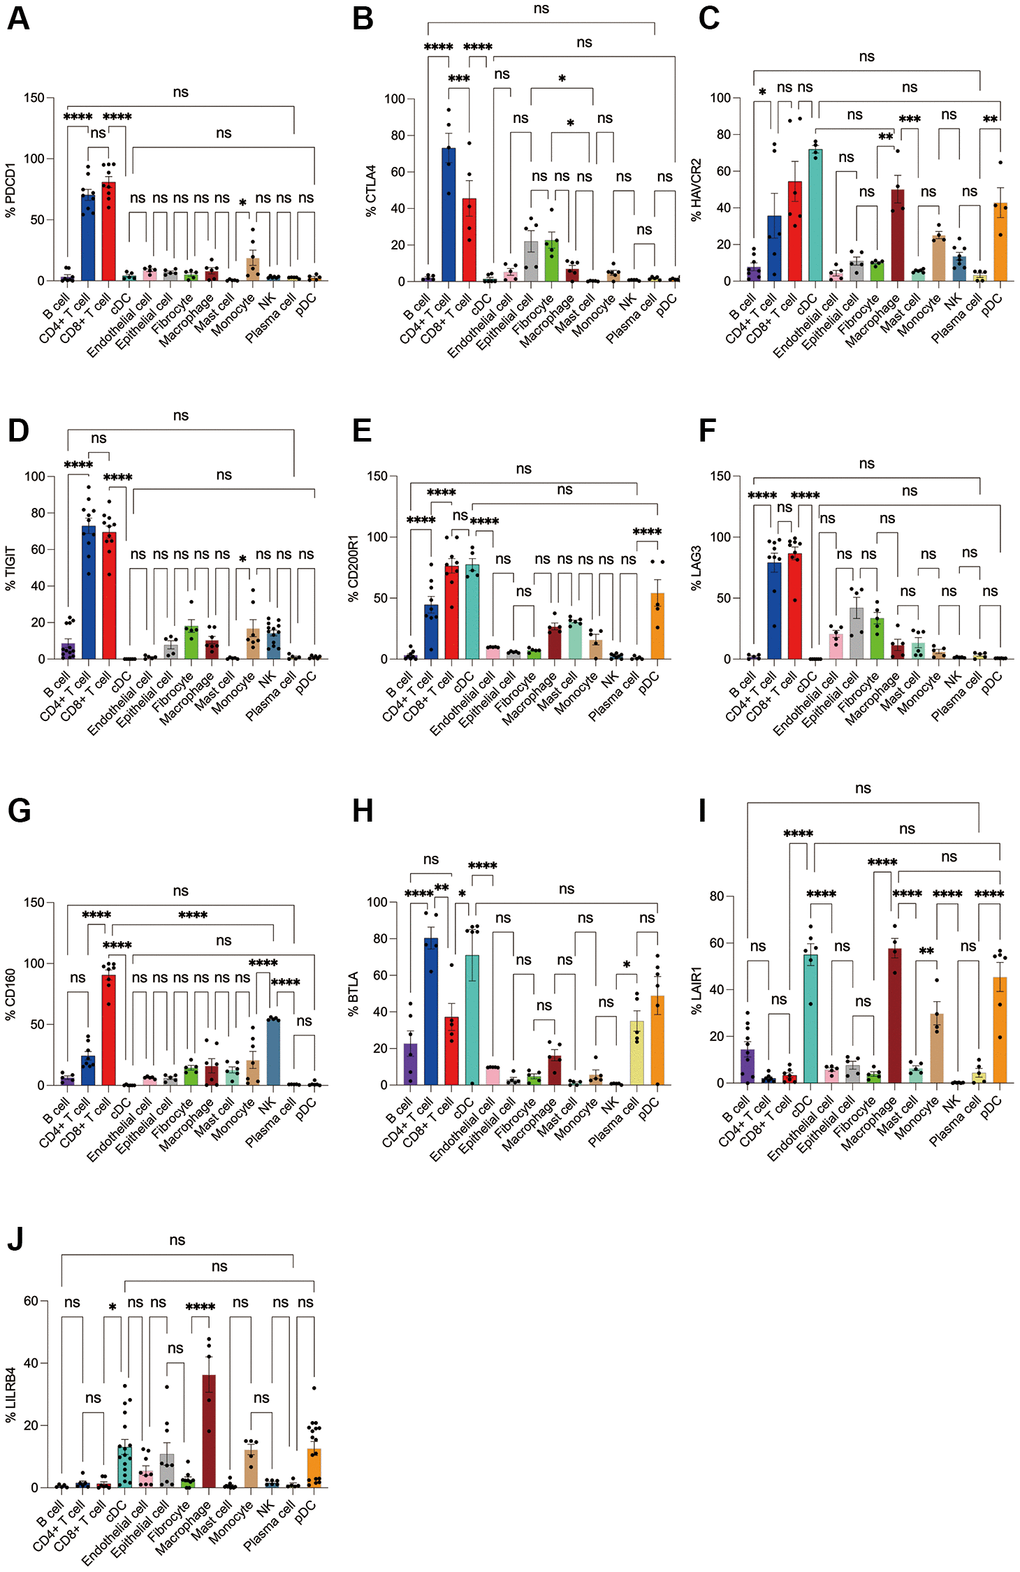
Figure 6.Flow cytometry analysis of the differences in the expression proportions of 10 immune checkpoint receptors in 13 cell subsets in human lung cancer. (A) Flow cytometry analysis of the expression ratio of PD-1 in 13 cell subsets; (B) Flow cytometry analysis of the expression ratio of CTLA4 in 13 cell subsets; (C) Flow cytometry analysis of the expression ratio of HAVCR2 in 13 cell subsets; (D) Flow cytometry analysis of the expression ratio of TIGIT in 13 cell subsets; (E) Flow cytometry analysis of the expression ratio of CD200R1 in 13 cell subsets; (F) Flow cytometry analysis of the expression ratio of LAG3 in 13 cell subsets; (G) Flow cytometry analysis of the expression ratio of CD160 in 13 cell subsets; (H) Flow cytometry analysis of the expression ratio of BTLA in 13 cell subsets; (I) Flow cytometry analysis of the expression ratio of LAIR1 in 13 cell subsets; (J) Flow cytometry analysis of the expression ratio of LILRB4 in 13 cell subsets.