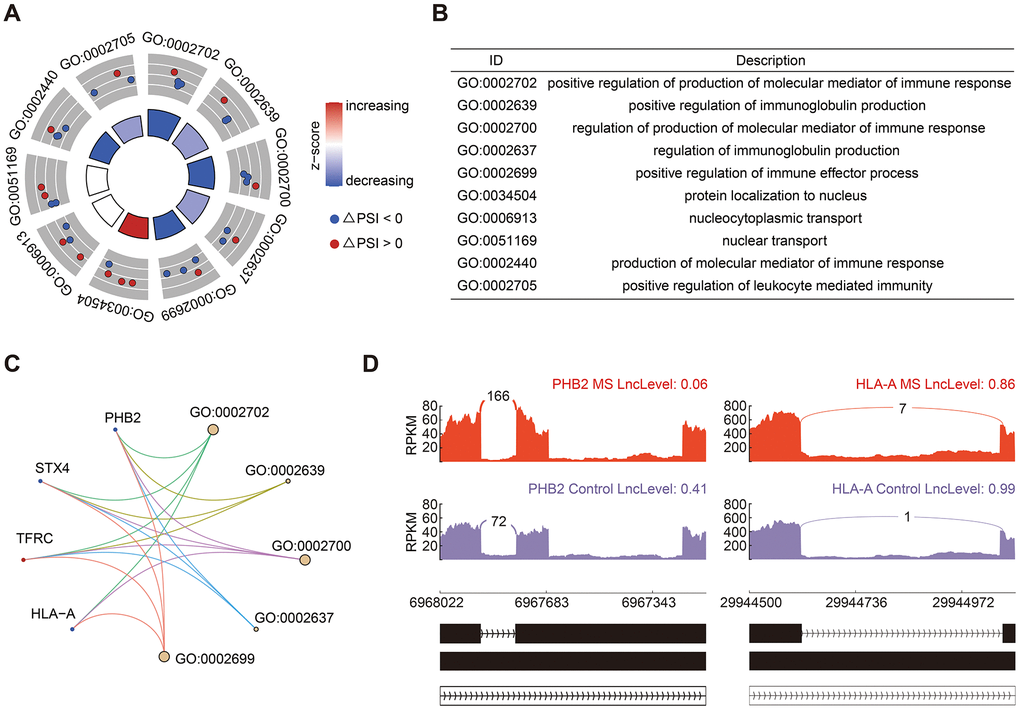
Figure 4.Analysis of RI events. (A, B) GO enrichment analysis of genes in RI events. (C) Cnetplot of genes involved in RI events. The decreased and increased PSI values were colored in blue and red, respectively. (D) Sashimi plots showed the detailed distribution of PHB2 and HLA-A transcripts.