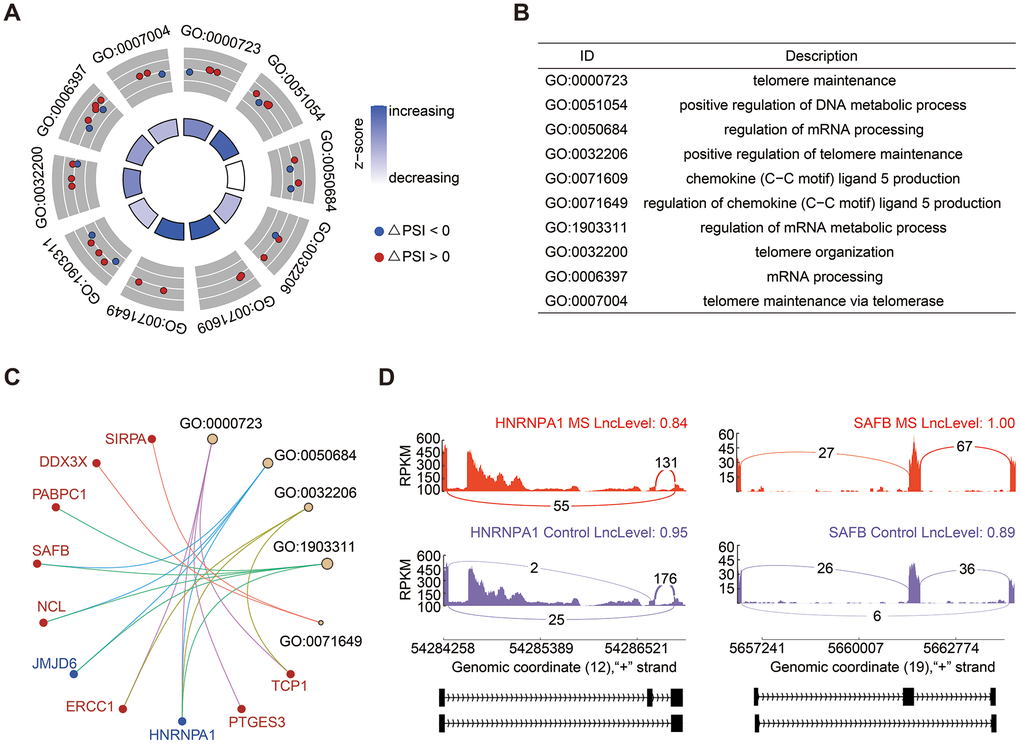
Figure 2.Analysis of SE events. (A, B) GO enrichment analysis of genes associated with SE events. (C) Cnetplot illustrating genes within enriched GO terms. HNRNPA1, highlighted in blue, exhibited decreased PSI levels, while SAFB, highlighted in red, demonstrated increased PSI levels. (D) Detailed sashimi plots depicting the splicing patterns of HNRNPA1 and SAFB. The red and purple colors denote the MS and control groups, respectively.