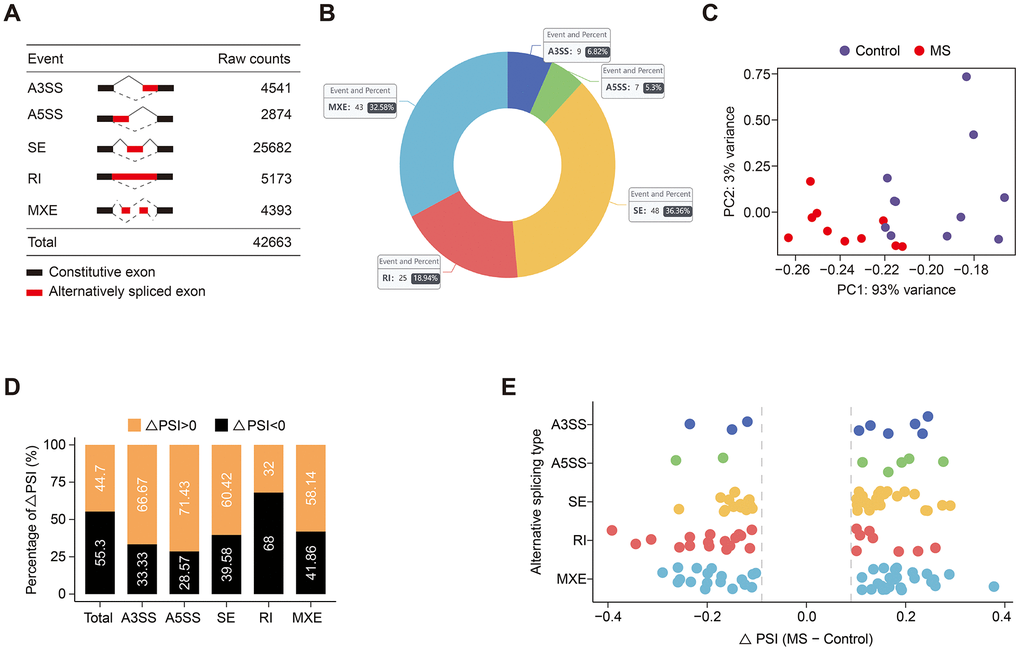
Figure 1.Global distribution of alternative splicing events. (A) Raw counts of each AS event. (B) The number and percentage of significant AS events. (C) PCA plot of each sample based on PSI values. (D, E) Bar (D) and dot (E) plots illustrate the ∆PSI distribution of each subtype and global AS events.