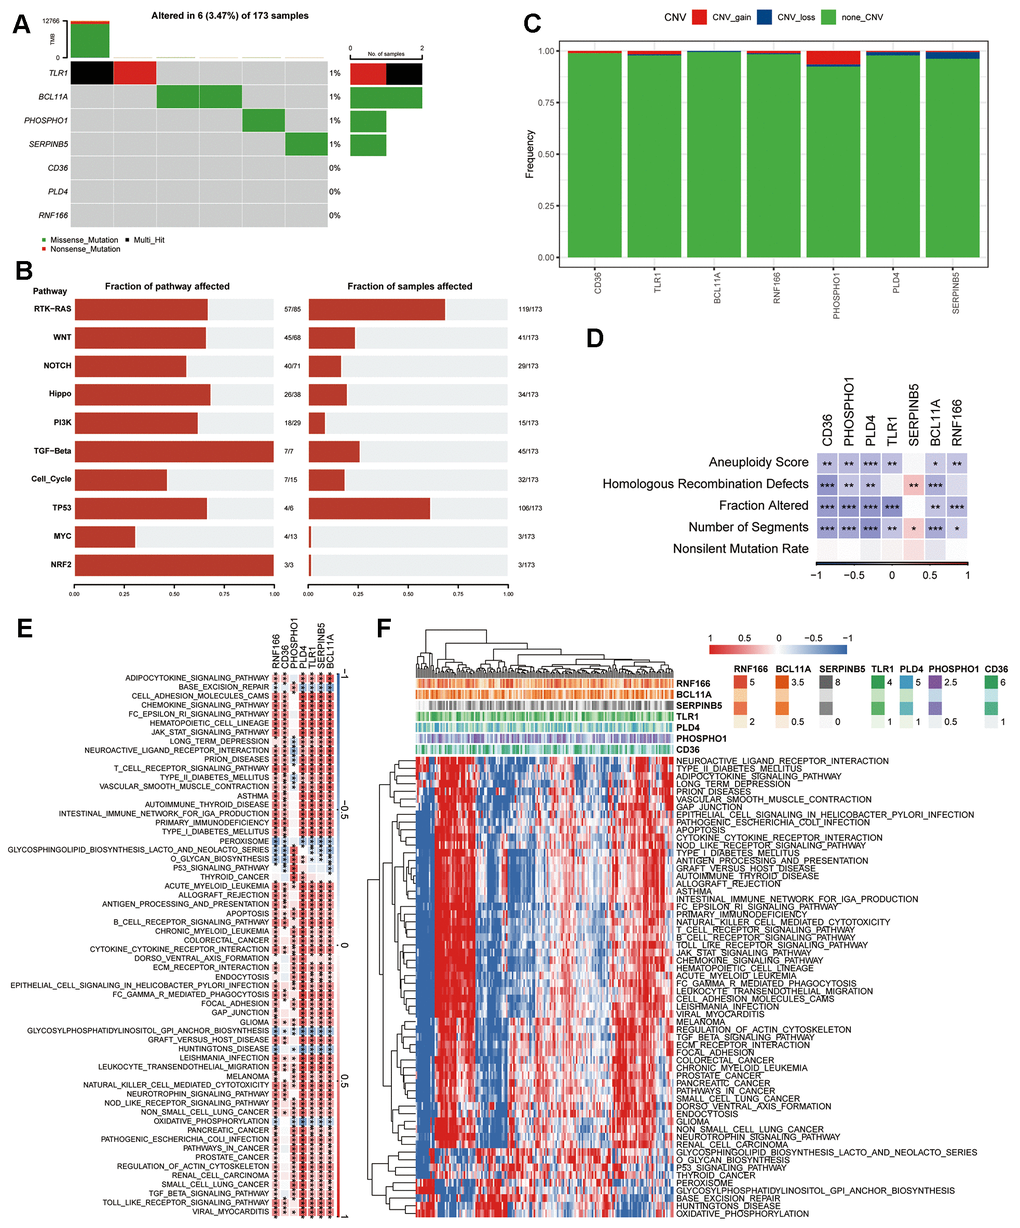
Figure 5.Genetic profile of the seven genes in the risk signature. (A) Waterfall diagram illustrating SNV mutations of the seven pivotal genes. (B) Enrichment heatmap displaying key pathways associated with SNV data in PAAD. (C) CNV alterations in the seven crucial genes, showcasing instances of gain, loss, and absence of alterations. (D) Heatmap visualizing correlations between the seven pivotal genes and Aneuploidy Score, Homologous Recombination Defects, Fraction Altered, Number of Segments, and Nonsilent Mutation Rate. (E) Heatmap revealing gene-pathway correlations. (F) Heatmap illustrating enrichment scores for pathways. *P < 0.05, **P < 0.01, ***P < 0.001.