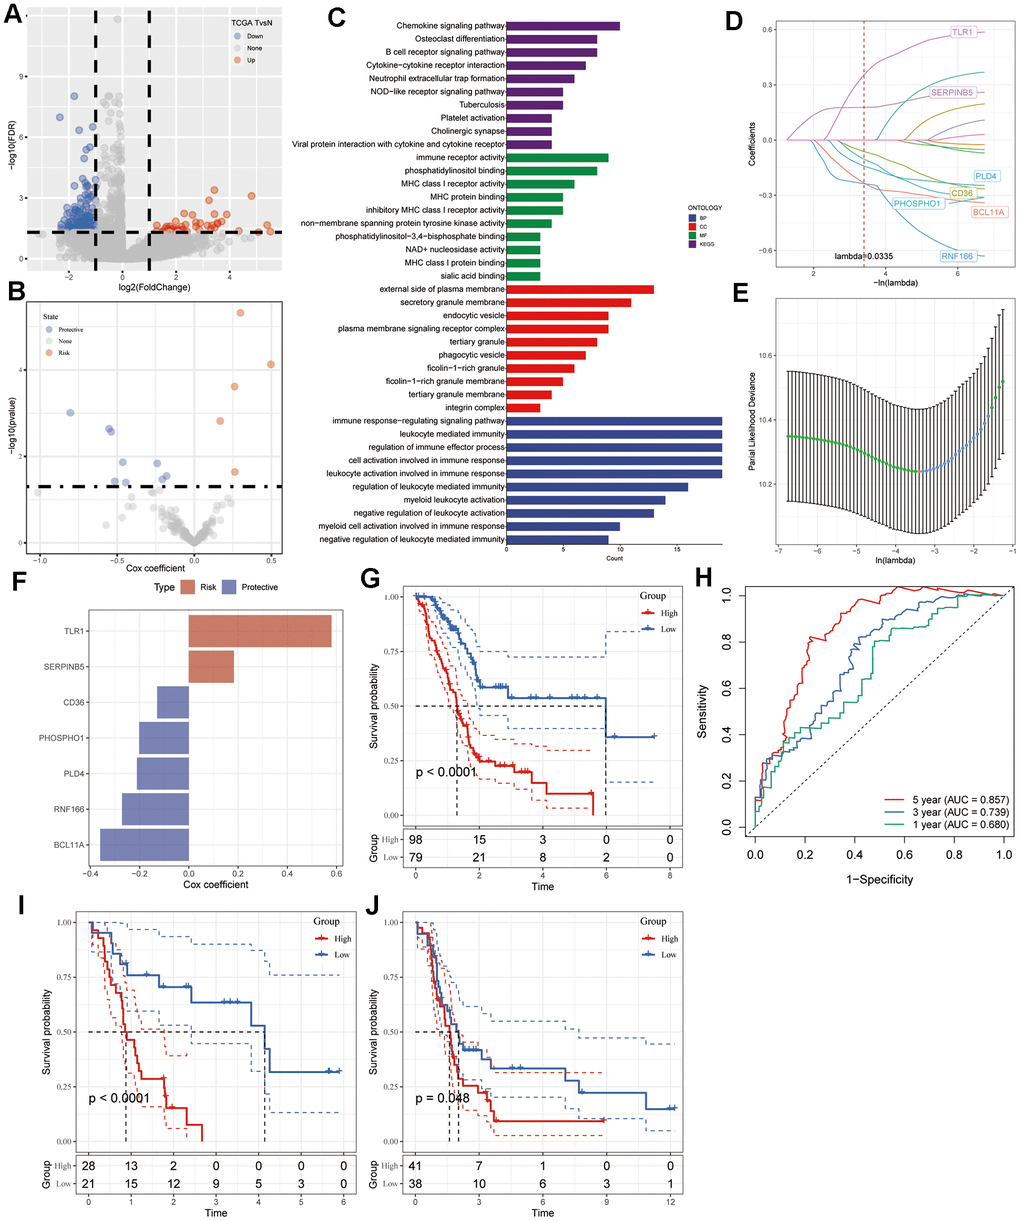
Figure 3.Identification of CAF-associated hub genes with prognostic significance. (A) Volcano plot illustrating DEGs between tumor and normal tissues in the TCGA-PAAD cohort. (B) Volcano plot showcasing prognosis-related genes identified through univariate Cox regression analysis. (C) Functional enrichment analyses encompassing GO (BP, CC, and MF) and KEGG analyses of CAF-related DEGs. (D) Trajectory plot depicting each independent variable with lambda in the LASSO model for PAAD. (E) LASSO coefficient profiles highlighting the seven genes in PAAD. The plot shows coefficient profiles against the log (lambda) sequence. (F) Multivariate Cox coefficients for each gene in the risk signature. (G) Kaplan-Meier curves illustrating the risk model constructed using the seven genes in the TCGA-PAAD cohort. (H) ROC curves displaying the risk model constructed with the seven genes in the TCGA-PAAD cohort. Kaplan-Meier curves of the risk model constructed with the seven genes in the validation datasets (I) GSE78229 and (J) GSE85916.