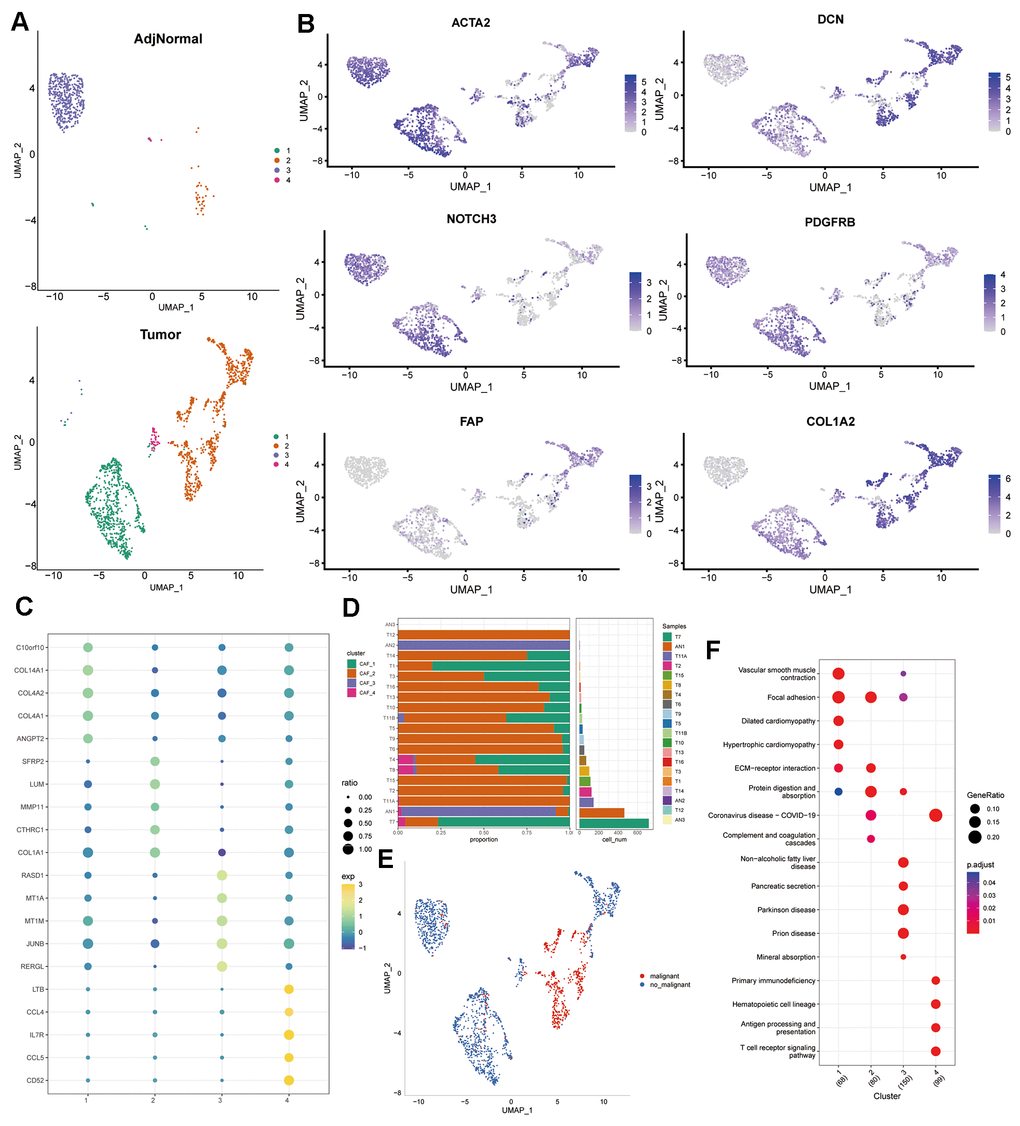
Figure 1.Profiling of CAF subpopulations. (A) UMAP plot displaying the distribution of four distinct CAF subpopulations post-clustering. (B) UMAP plot illustrating the expression of CAF marker genes (ACTA2, FAP, PDGFRB, NOTCH3, DCN, and COL1A2). (C) Dot plot showcasing the top 5 marker gene expressions across the four CAF clusters. (D) Relative proportions and cell numbers within each sample for the four CAF clusters. (E) UMAP plot delineating the distribution between malignant and non-malignant cells. (F) KEGG enrichment analysis of DEGs observed across the four CAF clusters.