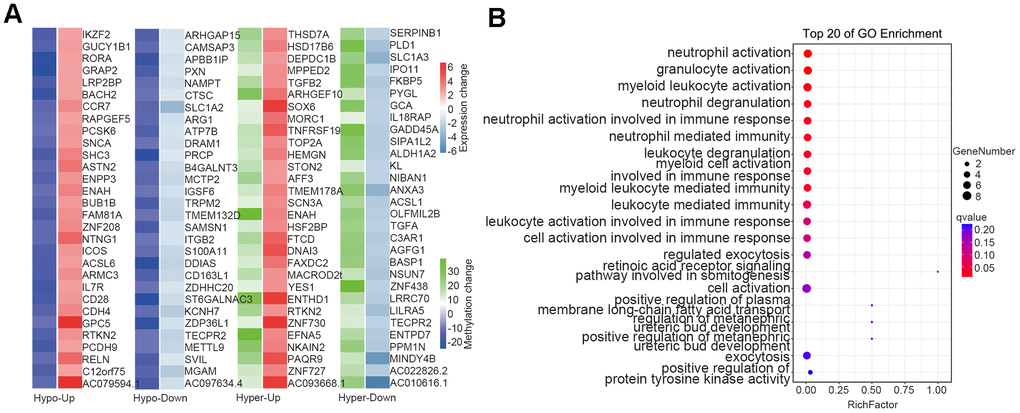
Figure 6.Overlap between DMGs and DEGs. (A) Heatmap of methylation and expression changes of the overlapping DMGs and DEGs. The first column of each group corresponds to the methylation change (Blue: Hypomethylated, Green: Hypermethylated), while the second column represents the gene expression change (Red: Upregulated, Right blue: downregulated). (B) Pathway enrichment analysis of overlapping genes in methylation and mRNA datasets. The 20 most significantly enriched pathways are illustrated in dot plots. Gene ratio refers to the proportion of DEGs belonging to a specific term. Node size (count) refers to the number of DEGs within each term and the color indicates the level of significantly (− log10 P-value). DMGs differentially methylated genes, DEGs differentially expressed genes.