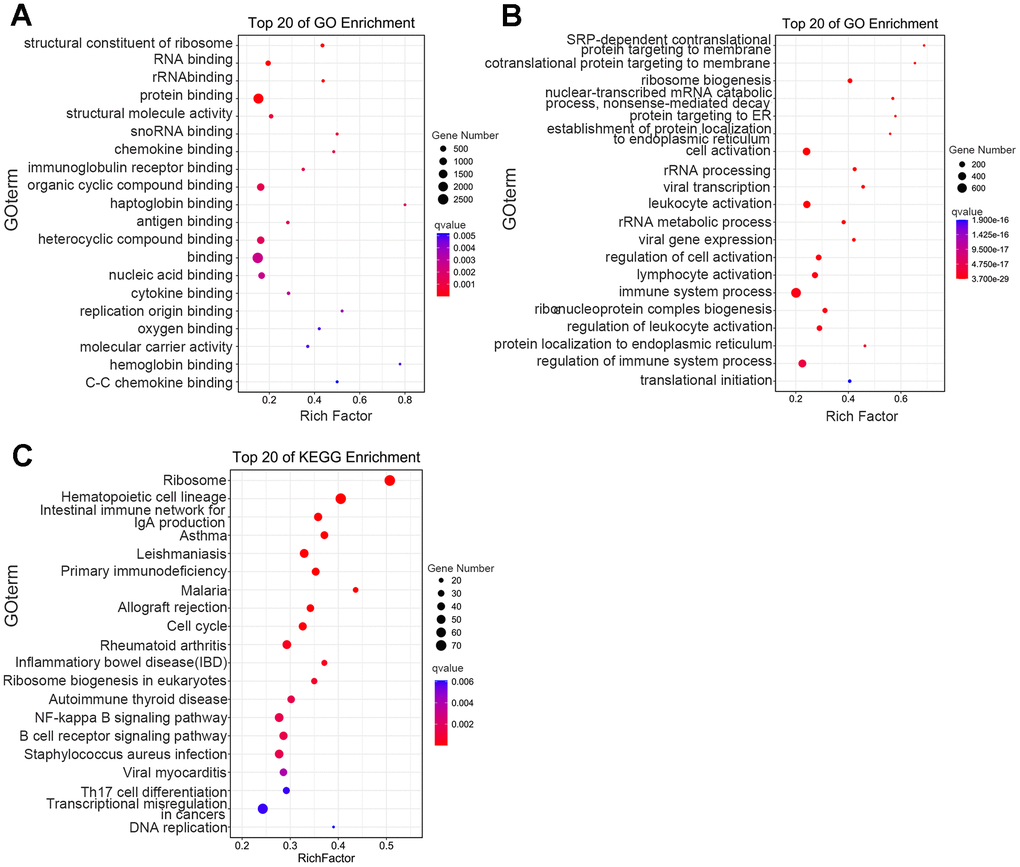
Figure 3.Functional-enrichment analysis of differentially expressed genes by GO and KEGG. The 20 most significantly enriched biological functions using GO (A, B) and KEGG (C) are illustrated in dot plots. Rich factor refers to the proportion of DEGs belonging to a specific term. Node size (gene number) refers to the number of DEGs within each term and node color indicates the level of significance (−log10 p-value).